Blog
In our blog, our employees post what they found particularly exciting in their day-to-day work. If they learn something new or think something could be interesting for customers, a post is written in each case. Everything about Business Intelligence, Power BI and Microsoft Dynamics. Have fun reading!
#ThePowerofDataForSuccess

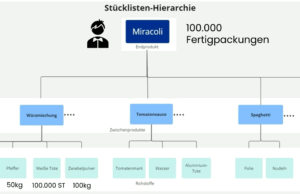
Miracoli, parts lists and ERP: How BI solutions can improve your liquidity
When you think of Miracoli, many people immediately think of student food or quick meals. But Miracoli is also a prime example of how bills of materials and sales planning can be

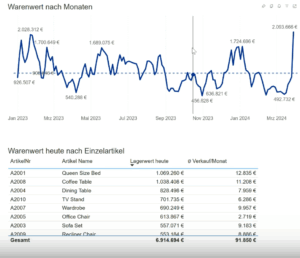
How does the "heartbeat" of your stock save you money?
When you log in to your bank, you've probably already seen the history of your account balance as a graph. Now imagine that you have

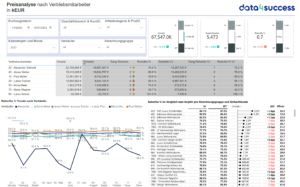
Transparency in sales performance: margin analysis of your employees
In many companies, sales performance is primarily measured by turnover. However, turnover alone is not always meaningful. The decisive factor for the sustainable success of a company is

Customer and article analysis in ERP: an interactive report for better insights
Many ERP systems such as Microsoft Dynamics NAV (formerly Navision) or Business Central offer comprehensive data, but often do not allow graphical analysis. Especially when

The e-bill: a spectre or a simple changeover?
The topic of e-invoicing has been omnipresent in recent months. Especially now, during the Christmas season, many companies receive letters from their creditors informing them that they

Quality assurance in communication: The CHECK principle of IBCS
Welcome to another article in our series on the International Business Communication Standards (IBCS). Today we take a look at the CHECK principle, the fifth

Conciseness in communication: the CONDENSE principle of IBCS
Welcome back to our series on the International Business Communication Standards (IBCS). In today's article, we focus on the CONDENSE principle, the fourth element

Clear paths through the data jungle: the SIMPLIFY principle from IBCS
Welcome back to our series on the International Business Communication Standards (IBCS). In today's article, we face a key challenge in business communication: How can

Learn something new every day: our 2024 Christmas party with a difference!
In our job as consultants for business intelligence and AI, one thing is clear: we always have to be open to new things. Learning is part of our everyday life

Expressiveness in business communication: The EXPRESS principle of IBCS
Welcome to another insightful article in our series on the International Business Communication Standards (IBCS). Today we are focusing on the EXPRESS principle, the fifth

Why looking at the previous year is no longer enough: an appeal for data-driven decisions
There is a fundamental problem in the German economy: controllers and sales staff often only compare their data with the previous year. This method may work in stable

Structure creates clarity: the STRUCTURE principle of IBCS
Welcome back to our continuing series on the International Business Communication Standards (IBCS). In this post, we will take a closer look at the fourth principle of the SUCCESS formula

Analysis of margins and prices for articles and customer groups
Do you know the margins of your articles? Many companies know which customer generates which turnover or which articles are the most successful. But what about

Clear messages, strong impact: the SAY principle of IBCS
Welcome back to our series on the International Business Communication Standards (IBCS). Today we dive deeper into the SAY principle of the SUCCESS formula. SAY, the

Magic Excel files - Automated data updating for greater efficiency
Who isn't familiar with monthly reporting, budget monitoring and sales reports? For many of us, this usually means logging into ERP systems such as Microsoft

How companies can leverage hidden profit potential through targeted margin analysis
In the business world, everything revolves around the margin, not just turnover. Because while turnover describes the size of a company, the

Consistency creates clarity: the UNIFY principle of IBCS
Welcome to another article in our series on the International Business Communication Standards (IBCS). Today we are going to take an in-depth look at the UNIFY principle of SUCCESS

Effective business communication thanks to IBCS
Welcome to the first installment of our series on the International Business Communication Standards (IBCS). In this series, we will dive into the world of IBCS,

Integration of planning and reporting with Acterys in Power BI
In many companies, planning and data analysis go hand in hand. In order to manage a company successfully, decision-makers must always compare actual and planned data.

My volunteer work for the city vacations in Gelnhausen - thanks to data4success for their support
I'm Manuel John and I've been a passionate volunteer youth worker at the "Stadtferien" in Gelnhausen for over 10 years - a week-long vacation camp

Profit increase: Automated P&L for profit centers
In the modern business world, efficient financial management is a key success factor. Many companies are faced with the challenge of managing their interactive profit and loss account (P&L).

Selling price = costs + margin? Better give your money away for Christmas!
In the world of sales, and particularly in the world of business software such as Microsoft Dynamics NAV, Navision and Business Central, it is tempting to price

Detailed analysis of customers and articles: Maximize your potential with Power BI
In today's business world, it is essential to have a clear overview of item sales and customer trends. Unfortunately, many ERP systems (Enterprise

Difference between zero values and empty values
Many customers ask us why " " and "(empty)" are displayed in the Power BI Slicer. What does this mean? In the world of

More time at last! How Power BI for controllers handles all recurring tasks
Do you work in finance or controlling? Then today we would like to show you how to make the transition from the world of Excel to the fully automated reporting world. In

Power BI with as little data as possible in the cloud
The "normal" Power BI variant (everything in the cloud) would be to upload large Power BI files containing all the raw data to the cloud. This creates in

Summer party 2024: A day full of surprises and team spirit
On Sunday, June 23, 2024, data4success GmbH held its annual summer party, and it was a day that we will not soon forget.

How to sort date hierarchies in descending order in a hierarchical slicer in Power BI
In the world of business intelligence, the ability to efficiently analyze data from complex systems such as Microsoft Dynamics NAV (also known as Navision) and Business Central is a key factor.

Introduction to the Power BI Report Builder for Microsoft Dynamics NAV and Business Central users
Introduction The Power BI Report Builder is a Microsoft tool designed for the creation of paginated reports. These reports are particularly suitable

How to quickly add a date table in Power BI
If you use data from systems such as Microsoft Dynamics NAV, its predecessor Navision, or the newer Business Central in Power BI, integrating a

Customized evaluation of categories with the DAX function RANKX
In Microsoft Dynamics NAV, also known as Navision or Business Central, the ability to effectively analyze and organize data is critical to

Welcome Manuel!
Welcome aboard - Manuel John! We are pleased to introduce our new employee, who joins us with his impressive background in computational linguistics.

BI Technologies in Transition: Today vs Tomorrow
Changing technologies for BI Microsoft technologies are constantly evolving. In the following, I would like to present various compilations of technical components that are used today and in the

Fix Many-to-Many Relationships in Power BI: The Power of Bridge Tables and Bidirectional Cross Filtering
In the world of data analysis and business intelligence, Power BI has established itself as an indispensable tool for turning data into meaningful insights. But

Using sort columns to define the category sort order in the "Fields" parameter of Power BI.
In Power BI, the correct sorting of categories is critical to making sense of data in reports and visualizations. The Fields function allows you to sort fields and

Field Switch in Power BI: Simplify your data analysis with dynamic column selection
Effective data analysis is critical for companies using Microsoft Dynamics NAV, Navision and Business Central as their ERP systems. Power BI, the powerful business intelligence tool

Data-based color change of rows in Power BI tables or matrices
Visualizing data in table format is an effective way to present information and gain insights. In Microsoft Dynamics NAV, Navision and Business

Display animated GIFs in Power BI
In today's business world, data visualization and business intelligence play an increasingly important role. Companies are looking for ways to present data in an engaging and easy-to-understand way.

Chat GPT or AI consultant: Will business intelligence jobs be replaced?
In the rapidly evolving world of artificial intelligence and automated technologies, the question is whether chat GPT (Generative Pre-trained Transformer) or AI advisors pose a threat to

Power BI Helper: The external tool to support metadata management in Power BI Desktop
Power BI Desktop is a powerful application for creating interactive data visualizations and reports. For complex Power BI projects, especially in conjunction with Microsoft Dynamics NAV, Navision

Handling multiple date values in Power BI with DAX-Measure and a single date dimension table
When analyzing data in Power BI, you may need to work with multiple date dimensions. In some cases, you may only want to

Power BI: How to display a web page dynamically within Power BI using HTML5 Visual?
Power BI offers numerous options for visualizing and analyzing data. But did you know that you can also create a web page dynamically within Power BI?

Power BI: Display measures in rows
Power BI is a powerful business intelligence tool that allows you to connect, transform and visualize data from multiple sources. A

Welcome aboard!
We are proud to welcome our new employee Ms. Thu Trang Tran! With her years of experience in #BusinessIntelligence projects and her passion for #dataanalytics she will

Evaluate Corona infections in PowerBI
Here is an example of how the current Corona figures can be evaluated in Power BI. The figures update daily based on the data published on corona.rki.de.

Difficulties of the companies with VerpackG reports
According to my observation, companies currently have the following difficulties with the reporting of packaging data according to the new packaging law: The packaging materials and their weights per item

Excel Calculator for PackagingG
On the page https://data4success.de/rechner-verpackungsgesetz you will now find an Excel calculator with which online stores, producers and retailers can calculate simple reports to the Central Packaging Register Office themselves.

Microsoft Dynamics NAV module for PackagingG?
All users of the ERP system Microsoft Dynamics NAV who are affected by the Packaging Act (formerly Packaging Ordinance VerpackV) in Germany are now asking themselves how they can
