Increase margins with price analysis of your ERP
Our Pricing Report offers you an incomparable degree of clarity and depth, as it based on actual sales and purchase prices. This enables you to make quick and well-founded decisions and optimize the pricing strategy of your products or services. Complex pricing systems and sales structures are clearly analyzed by the pricing report. The report can be flexibly adapted according to granularity, either displaying the data per item and business area or per sales employee, region and customer. In this way, nothing escapes your attention. Even differences in customer-specific prices can be easily analyzed.
The report is offered at a fixed price on the basis of all Dynamics versions such as NAV, Business Central, D365 FO and SAGE 100. Other ERP systems are also possible on request.
What does our pricing report offer?
- Real-time price monitoringKeep an overview of your product prices at all times. Our tool provides you with current sales prices (not list prices) so that you can react flexibly to market changes.
- Margin analysesUnderstand exactly how price changes affect your margins. Our pricing report shows you where you can optimize prices to increase your profits.
- Focus on sales figuresAnalyze the impact of your pricing strategies on your sales figures. Recognize trends and patterns to increase your sales in a targeted manner.
- User-friendly reportsGet clear and concise reports that show you immediately where action is needed. Our user-friendly dashboards make data analysis simple and effective.
Our aim is to provide you with the right tools so that you can adapt your pricing strategies and optimize your margins in all scenarios. The price analysis report clearly shows you where potential is hidden in existing sales.
The report answers essential sales and product management questions:
- Which product has too low a gross profit?
- How are the articles / product groups developing?
- Which debtors have grown the most?
- How are debtors performing?
Try out the report right here:
The report consists of 3 pages
- The first page focuses on the Price analysis in the selected period
- Time filtering and various filters make it possible to quickly display the realized gross revenues with the desired granularity
- The development compared to the same period of the previous year is automatically displayed
- The second page focuses on the Sales analysis
- Sales figures per item, sales customer or salesperson are the focus here
- As on the first page, filters offer the option of displaying the data with the desired granularity
- The third page contains Details
- The best way to reach this page is to drill through from the other pages here
- Depending on the filtering in the drill-through, this page displays all available details. You can quickly view the items with sales price and gross profit for each document.
Would you also like a similar view for your business figures to which your managers have access? Then get in touch with us and we will take care of the rest. This type of view is one of the "basics" for us, whether with Microsoft Dynamics or any other system as a data source.

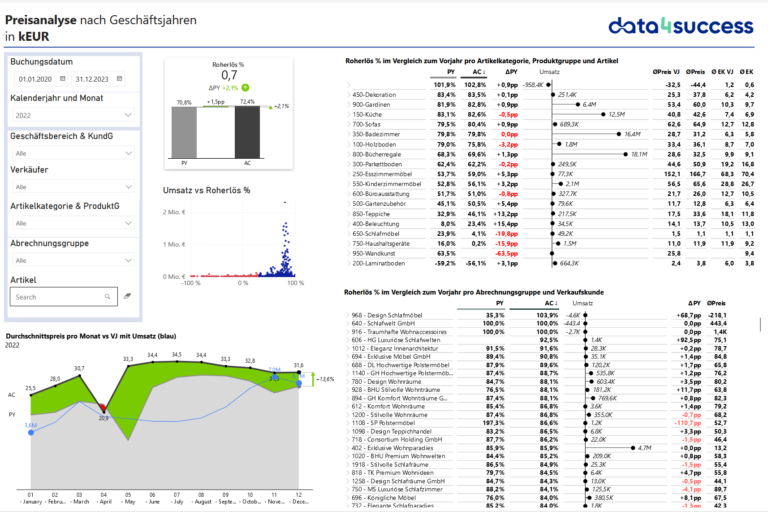
The price analysis provides a quick overview of the margin development in the selected period.
You can filter by seller, item category, item or billing group.
- The table at the top right shows the gross profit % and gross profit % PY, the sales trend and the average sales price and purchase price for each item category, product group and item
- The table at the bottom right shows the gross revenue % and gross revenue % PY, the sales trend and the average sales price and purchase price for each billing group and sales customer
- The graph shows the average price per month and PY in comparison; it is easy to identify the months in which the average price has fallen. The green area is the positive growth of the average price compared to the previous year
- The scatter diagram shows the relationship between sales and gross profit %, so you can quickly visualize the significance of a debtor to the overall picture
- The bar chart shows the development of gross profit % compared to the previous year
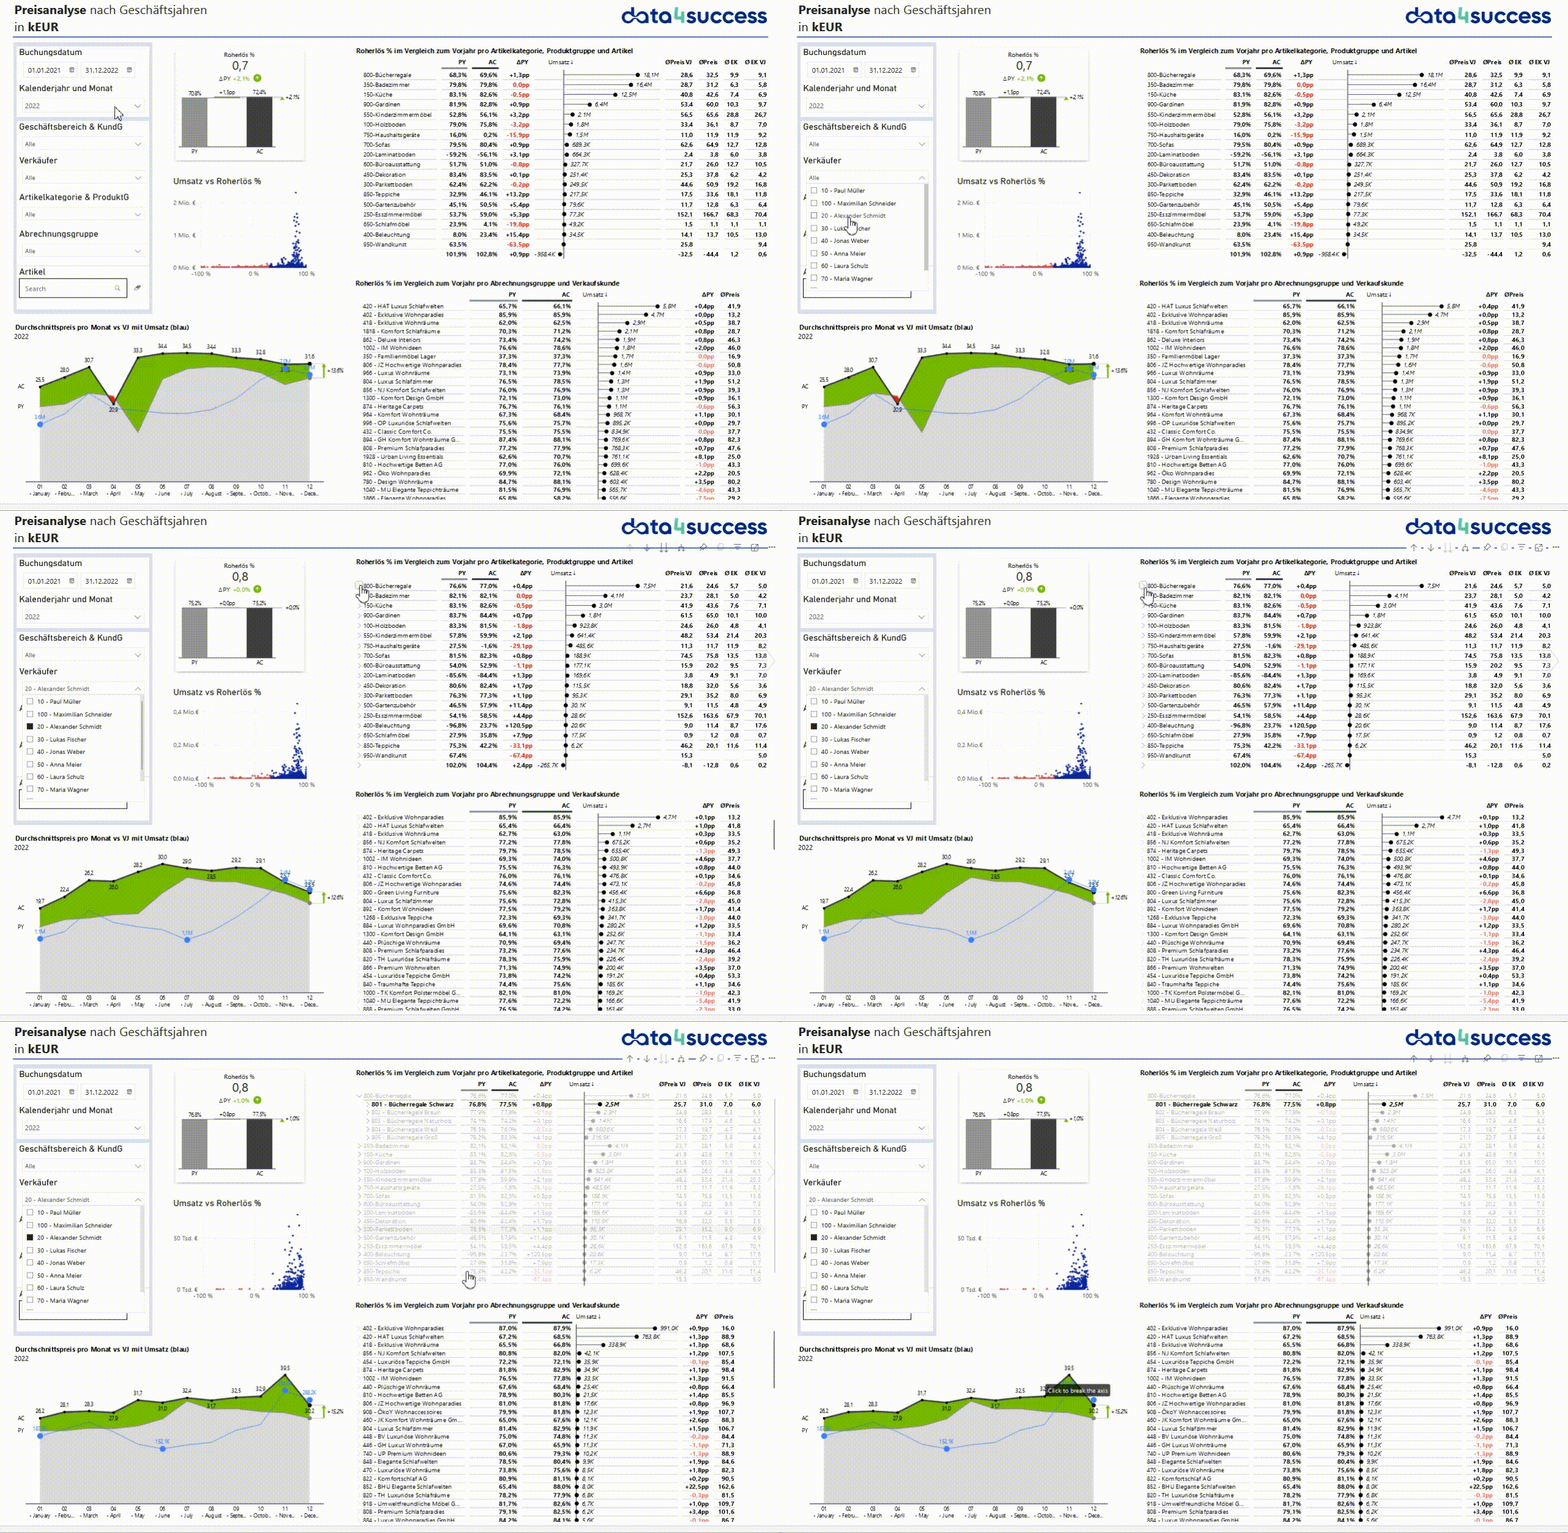
As soon as you select a row in a table, the other visualizations are filtered accordingly. This allows you to quickly analyze the margin of an individual product or customer

The sales analysis provides a flexible overview of sales development in the selected period. The corresponding categories for the comparison can be selected as required.
You can filter by seller, item category, item or billing group.
- The diagram at the top right shows the sales trend per month compared to the previous year. The color green represents the growth compared to the previous year.
- The bar chart at the top left shows the sales trend as a total compared to the previous year.
- The bar chart in the top center shows the sales volume compared to the previous year.
- The tables at the bottom left and right are identical. They both show the turnover, the previous year's turnover, Delta and Delta%. The buttons above the tables determine which data should be compared in the table. This allows you to flexibly compare the turnover per sales customer with the turnover per item.
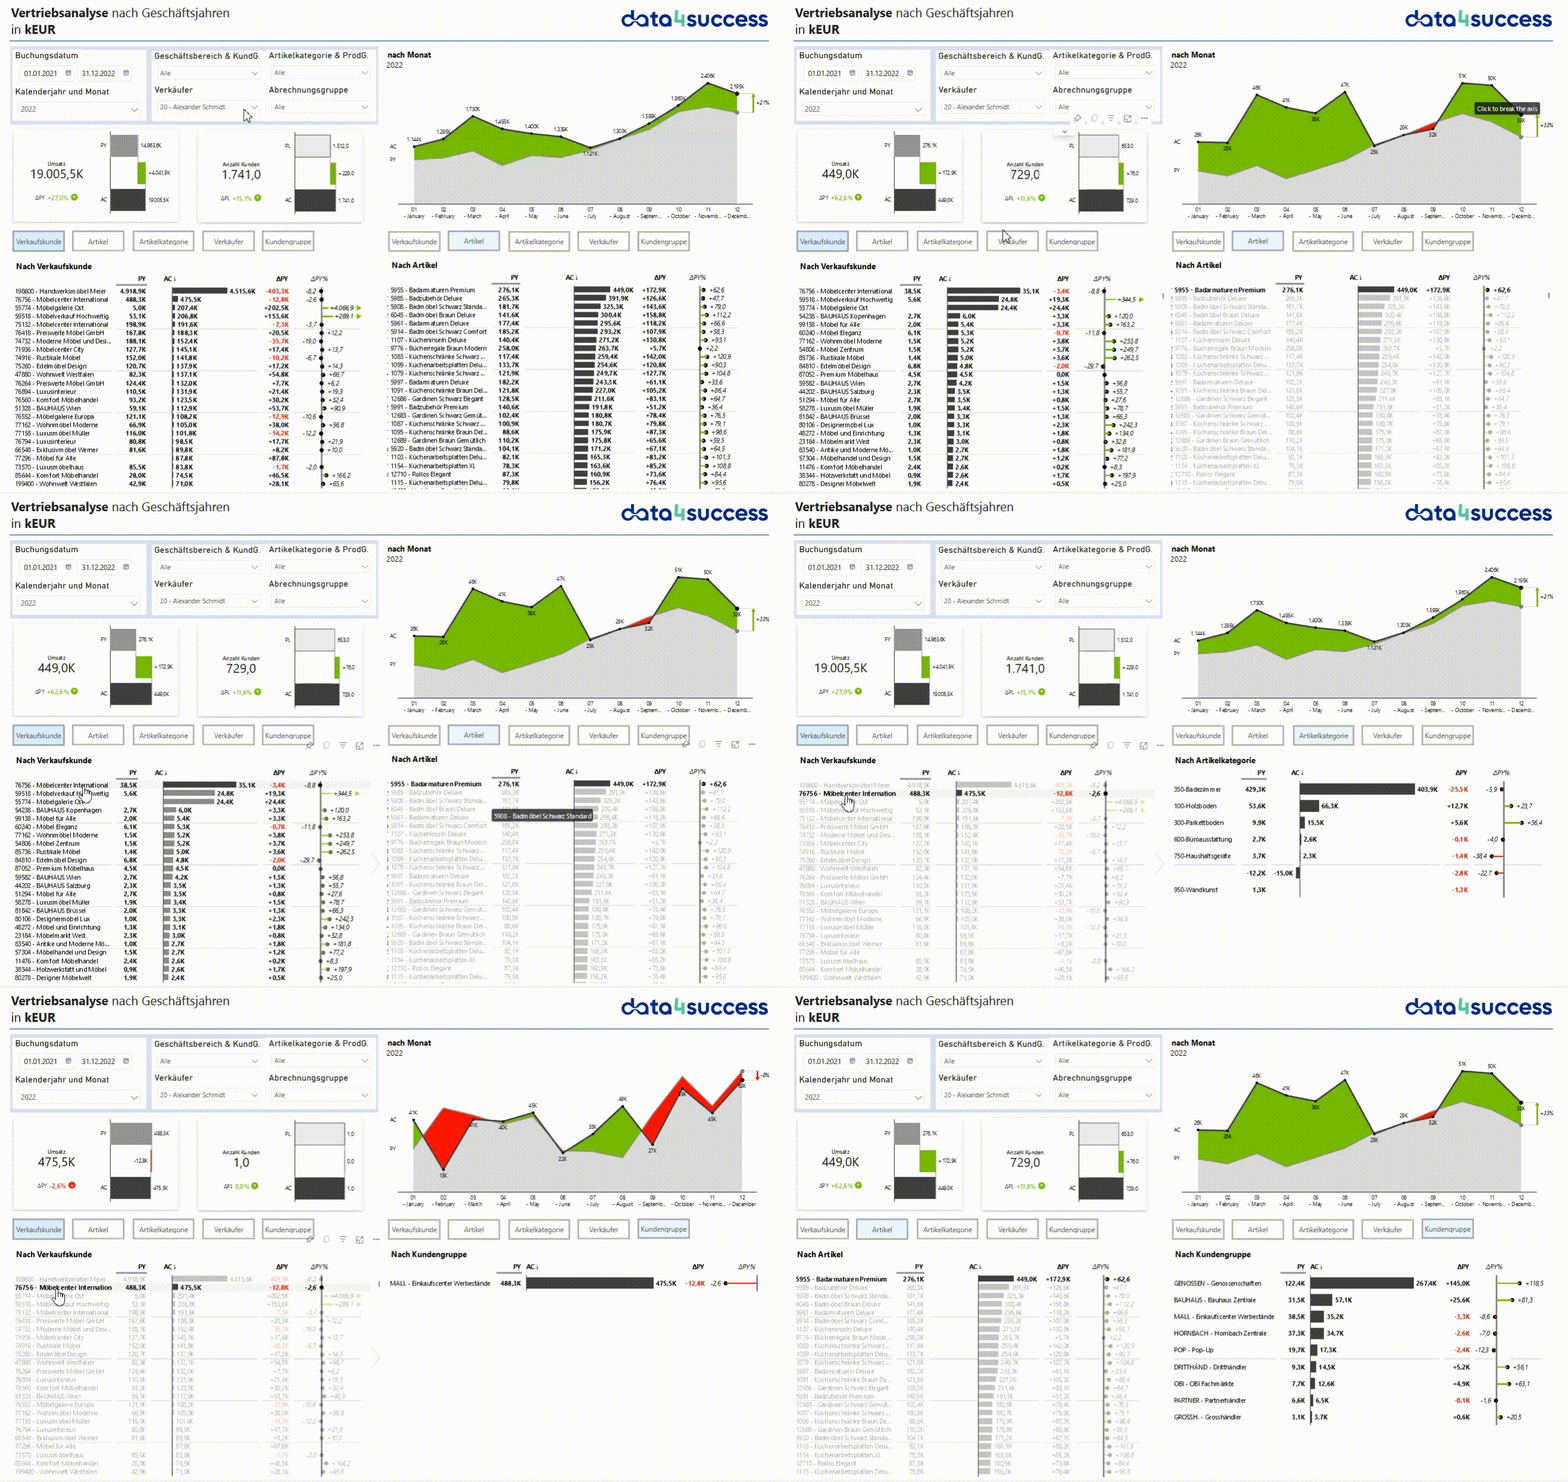
As soon as you select a row in a table, the other visualizations are filtered accordingly. This allows you to quickly analyze the margin of an individual product or customer

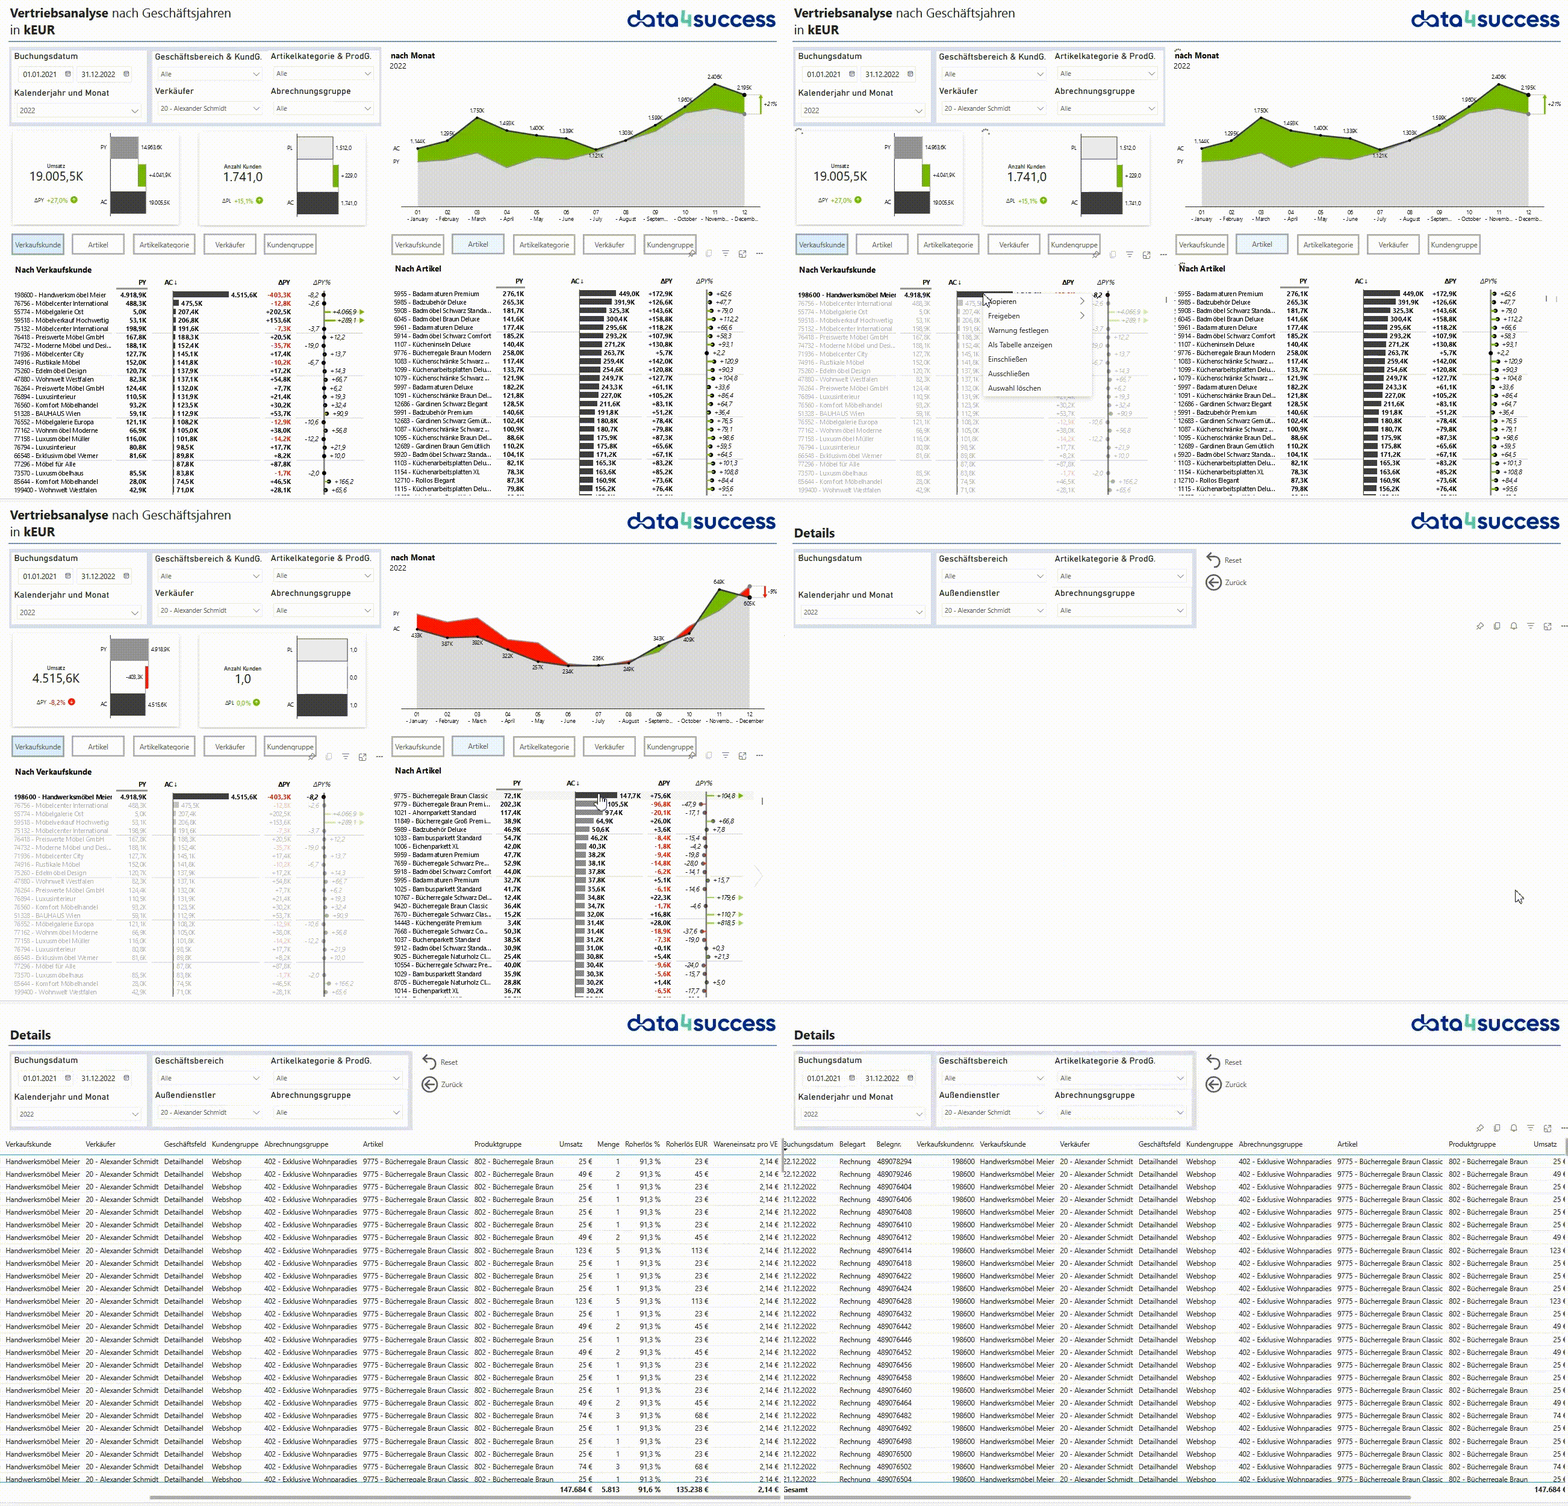
The Details page is best accessed by drilling through from the other two pages. The page offers various filters.
Here you can view the corresponding voucher items sorted by date and voucher number.
While the previous pages presented aggregated figures, this page allows you to analyze the sales figures in detail.
Arrange a non-binding consultation directly Appointment with our experts.
Please visit our Trainingif you want to learn more about Power BI and the world of Business Intelligence.
