
Field Switch in Power BI: Simplify your data analysis with dynamic column selection

Effective data analysis is critical for companies that use Microsoft Dynamics NAV, Navision and Business Central as their ERP systems. Power BI, Microsoft's powerful business intelligence tool, offers a feature called Field Switch that lets you dynamically select columns and simplify your data analysis. In this article, you will learn how to use the Field Switch [...]
Data-based color change of rows in Power BI tables or matrices

Visualizing data in table format is an effective way to present information and gain insights. In Microsoft Dynamics NAV, Navision and Business Central, popular ERP systems from Microsoft, data analysis plays a crucial role for businesses. In this article, you'll learn how to change the color of rows in Power BI tables or matrices based [...]
Display animated GIFs in Power BI
In today's business world, data visualization and business intelligence play an increasingly important role. Companies are looking for ways to present data in an engaging and easy-to-understand way. One popular solution for this requirement is to use Power BI, a business intelligence tool from Microsoft. In this article, we will focus on how to use animated GIFs in [...]
Chat GPT or AI consultant: Will business intelligence jobs be replaced?

In the rapidly evolving world of artificial intelligence and automated technologies, the question is whether chat GPT (Generative Pre-trained Transformer) or AI consultants pose a threat to traditional business intelligence jobs, especially those associated with Microsoft Dynamics NAV, Navision and Business Central. In this article, we explore how these technologies work and what impact they have on [...]
Power BI Helper: The external tool to support metadata management in Power BI Desktop

Power BI Desktop is a powerful application for creating interactive data visualizations and reports. In complex Power BI projects, especially in conjunction with Microsoft Dynamics NAV, Navision and Business Central, effectively managing and monitoring metadata can be a challenge. In this blog article, we introduce you to "Power BI Helper", an external tool specifically designed [...]
Handling multiple date values in Power BI with DAX-Measure and a single date dimension table

When analyzing data in Power BI, you may need to work with multiple date dimensions. In some cases, you may want to use only a single date dimension table and associate the different date types such as sales date, delivery date, and due date with it. In this blog article, you will learn how to use a single date dimension table and the USERELATIONSHIP [...]
Power BI: How to display a web page dynamically within Power BI using HTML5 Visual?

Power BI offers numerous options for visualizing and analyzing data. But did you know that you can also dynamically display a web page within Power BI? Using the HTML5 visual and an iFrame, you can seamlessly integrate external web pages into your report and link them to your data. In this blog post we will show [...]
Power BI: Display measures in rows

Power BI is a powerful business intelligence tool that allows you to connect, transform and visualize data from various sources. One of the most common visualizations in Power BI is the matrix, which provides a tabular representation of data with rows, columns and values. When you use Measures in a matrix, they [...]
Welcome aboard!

We are proud to welcome our new employee Ms. Thu Trang Tran! With her years of experience in #BusinessIntelligence projects and her passion for #dataanalytics, she will add significant value to our customers. #PowerBI and #SQL programming are part of her portfolio as well as #Tableau and SAP Analytics Cloud. Welcome on board!
Evaluate Corona infections in PowerBI
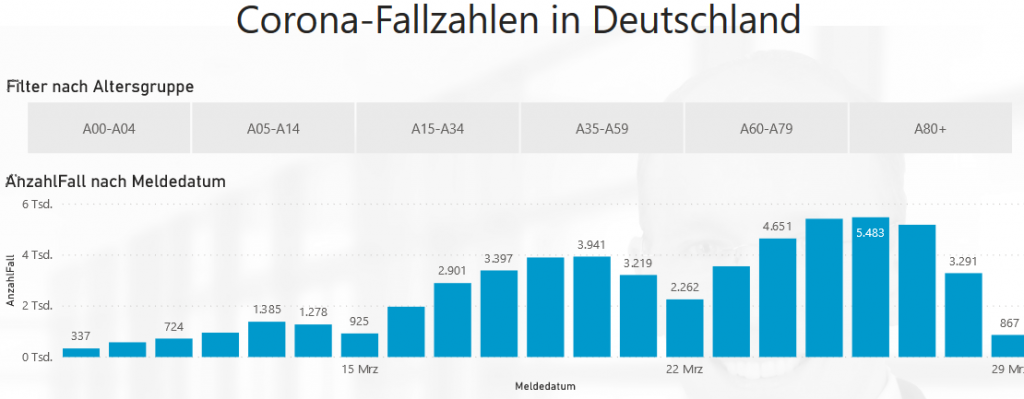
Here is an example of how the current Corona figures can be evaluated in Power BI. The numbers update daily based on the data published on corona.rki.de. The evaluation has 4 different pages at different aggregation levels. By clicking on the bars, you can filter everything else on each page. The corresponding PowerBI file can be [...]