
Microsoft Dynamics 365 Finance & Operations, or D365 F&O for short, integrates financial and operational processes into a single ERP environment. Dynamics 365 Finance and Dynamics 365 Supply Chain Management are closely integrated.
We use Power BI to make the data from these end-to-end processes available company-wide. As needed, we supplement this data with planned figures, historical data, and information from other systems.

Integrated Financial and Operational Processes

Shared Database

Company-wide analyses
In Dynamics 365 Finance & Operations, operational processes and financial entries are directly integrated. Sales, procurement, inventory, production, and projects, together with finance and controlling, form a unified process and data foundation. With Power BI, these relationships can be analyzed across companies, time periods, and financial dimensions.
View results, open items, budget figures, and financial trends across companies, time periods, and financial dimensions.
Analyze revenue, margins, orders, and customer trends.
Analyze orders, suppliers, prices, and quantities.
Make inventory levels, goods movements, and stock-out thresholds transparent.
Track material requirements, production orders, and manufacturing progress.
Jointly evaluate costs, revenues, budgets, and project progress.
In Dynamics 365 Finance & Operations, key business processes are already integrated. In larger organizations, additional entities, planning solutions, historical ERP data, and operational systems are often involved. For enterprise-wide reporting, this information must be consistently structured and analyzed collectively.
This creates a reliable foundation for group controlling, FP&A, and company-wide management.
Analyze planning, CRM, and other business data together with D365 F&O data.
Consistently account for currencies, periods, financial dimensions, and organizational structures.
Use historical data from Microsoft Dynamics AX, INTEX, or other legacy systems to perform end-to-end comparisons with current D365 F&O data.
Compare planned, forecast, and actual values across periods and companies.
The following examples show typical reports for finance, sales, procurement, warehousing and inventory, production, and planning and forecasting. Which of these can be implemented depends on the modules in use, the configuration, and the available data.
Analyze income statements, balance sheets, open items, and liquidity across companies, periods, and financial dimensions—from monthly closings to group-wide controlling.
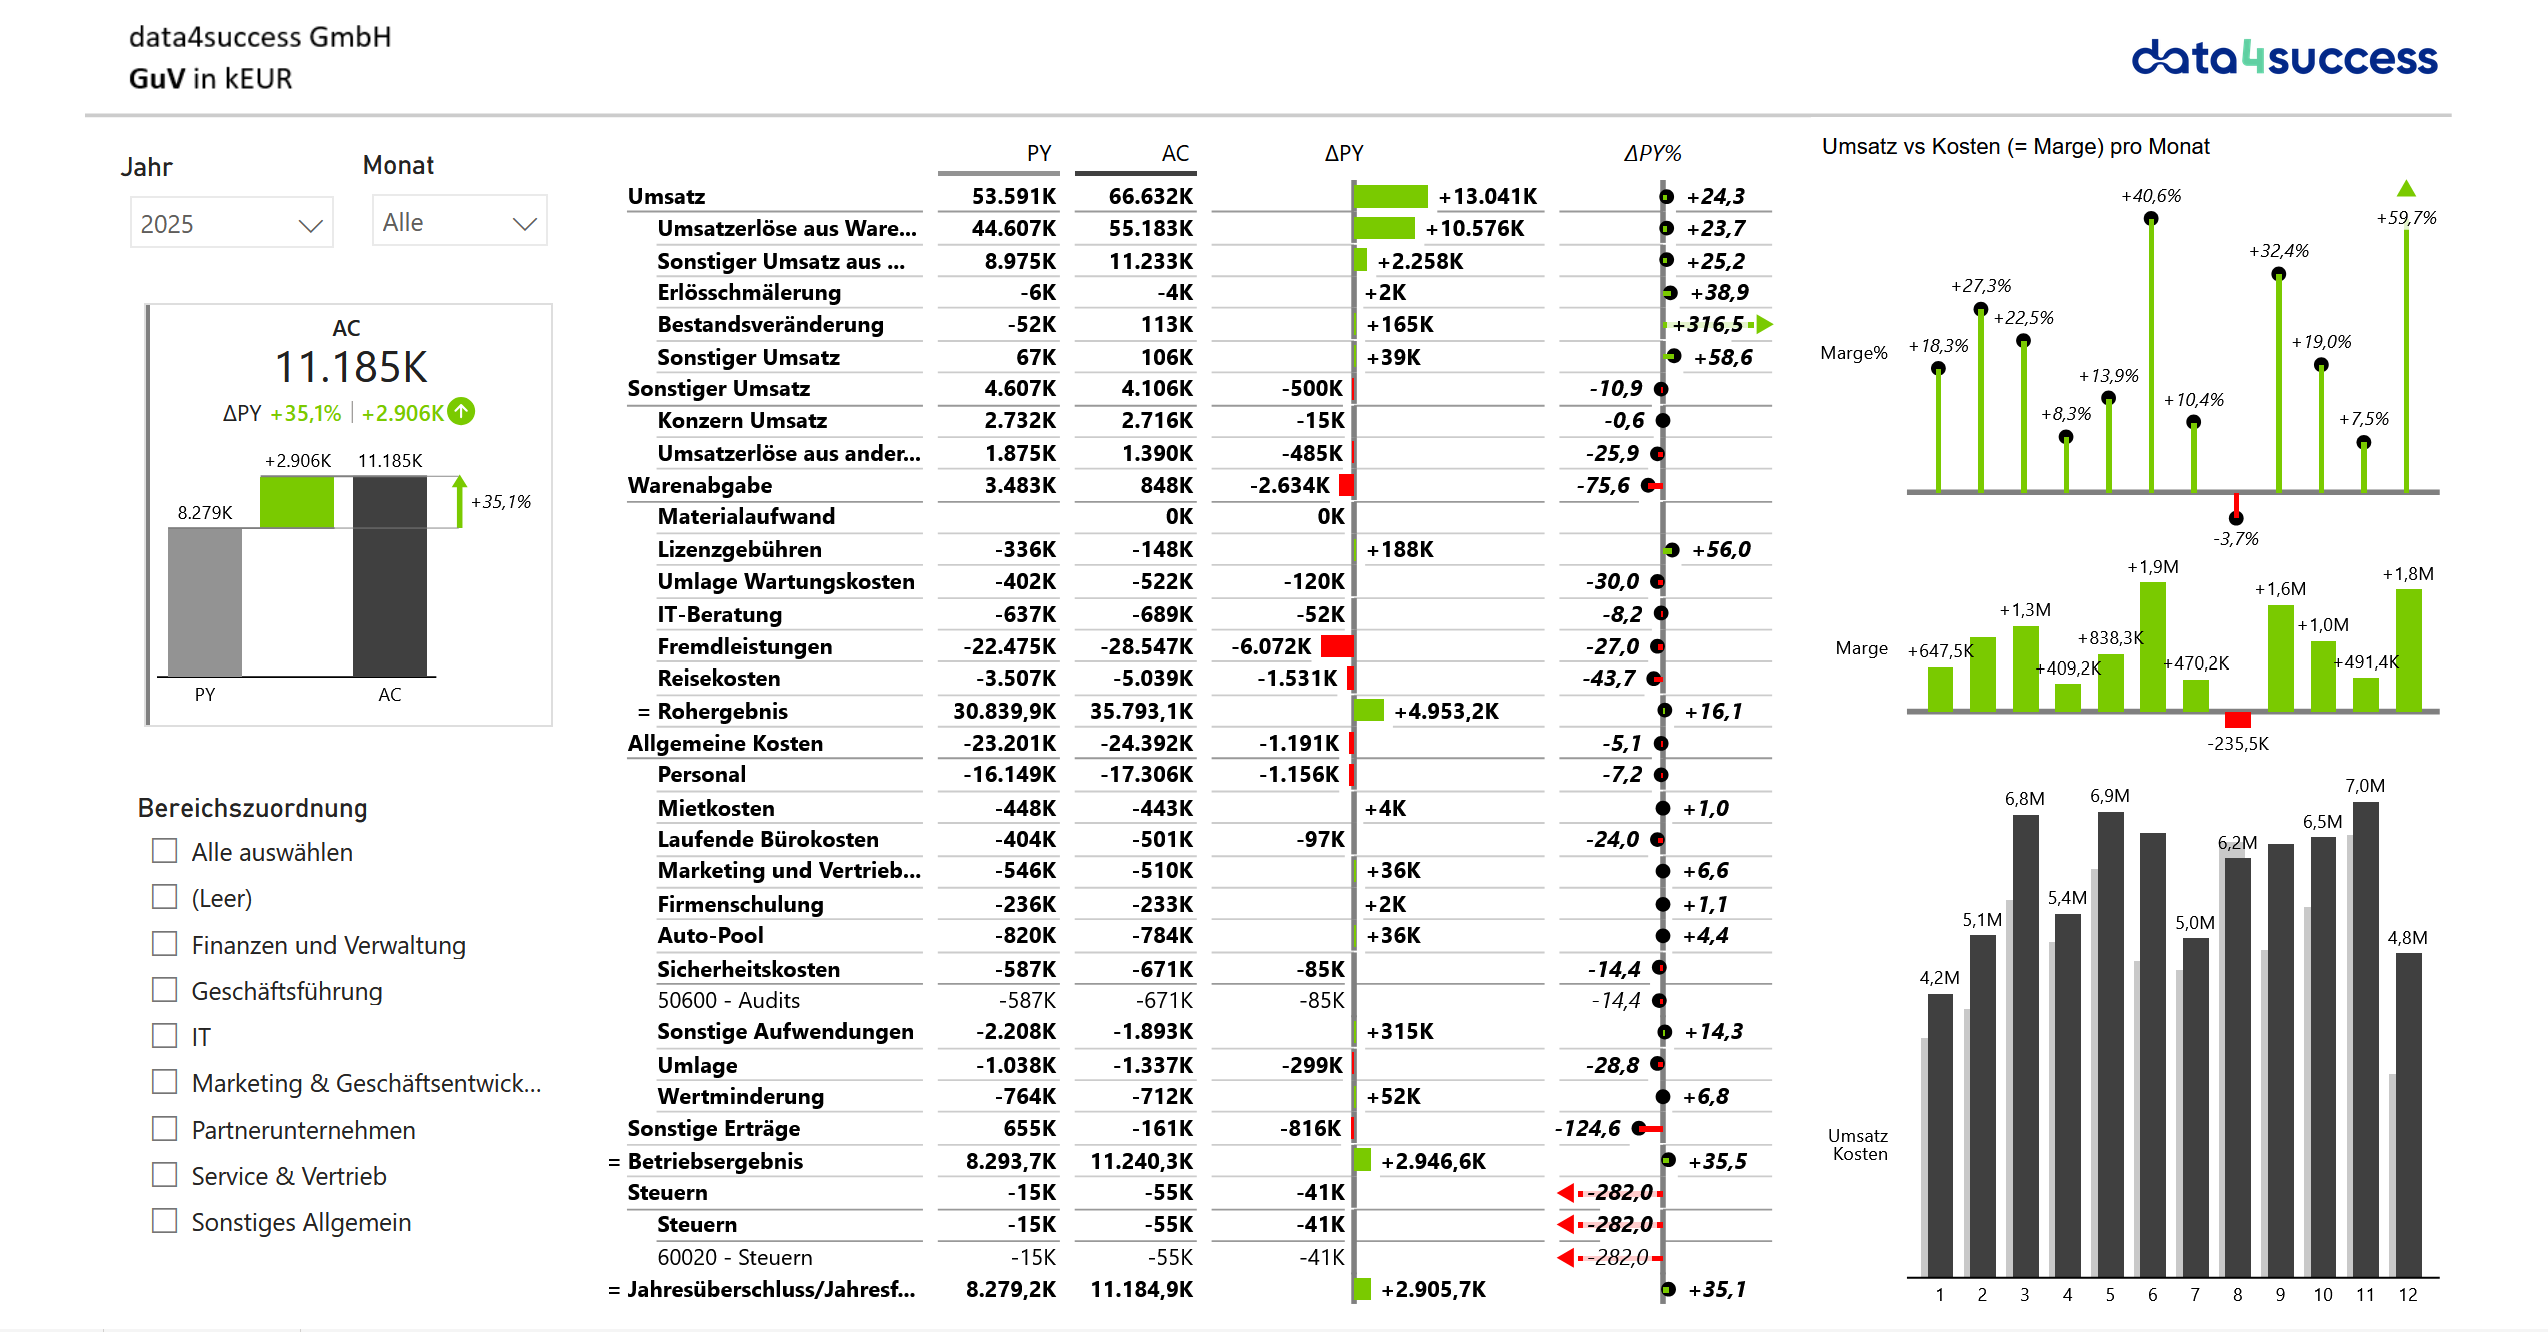
Example of a Power BI financial report with sample data. Click on the report to enlarge it.
Orders, invoices, credit memos, and returns form the basis for analyses by customer, item, product line, and business unit.
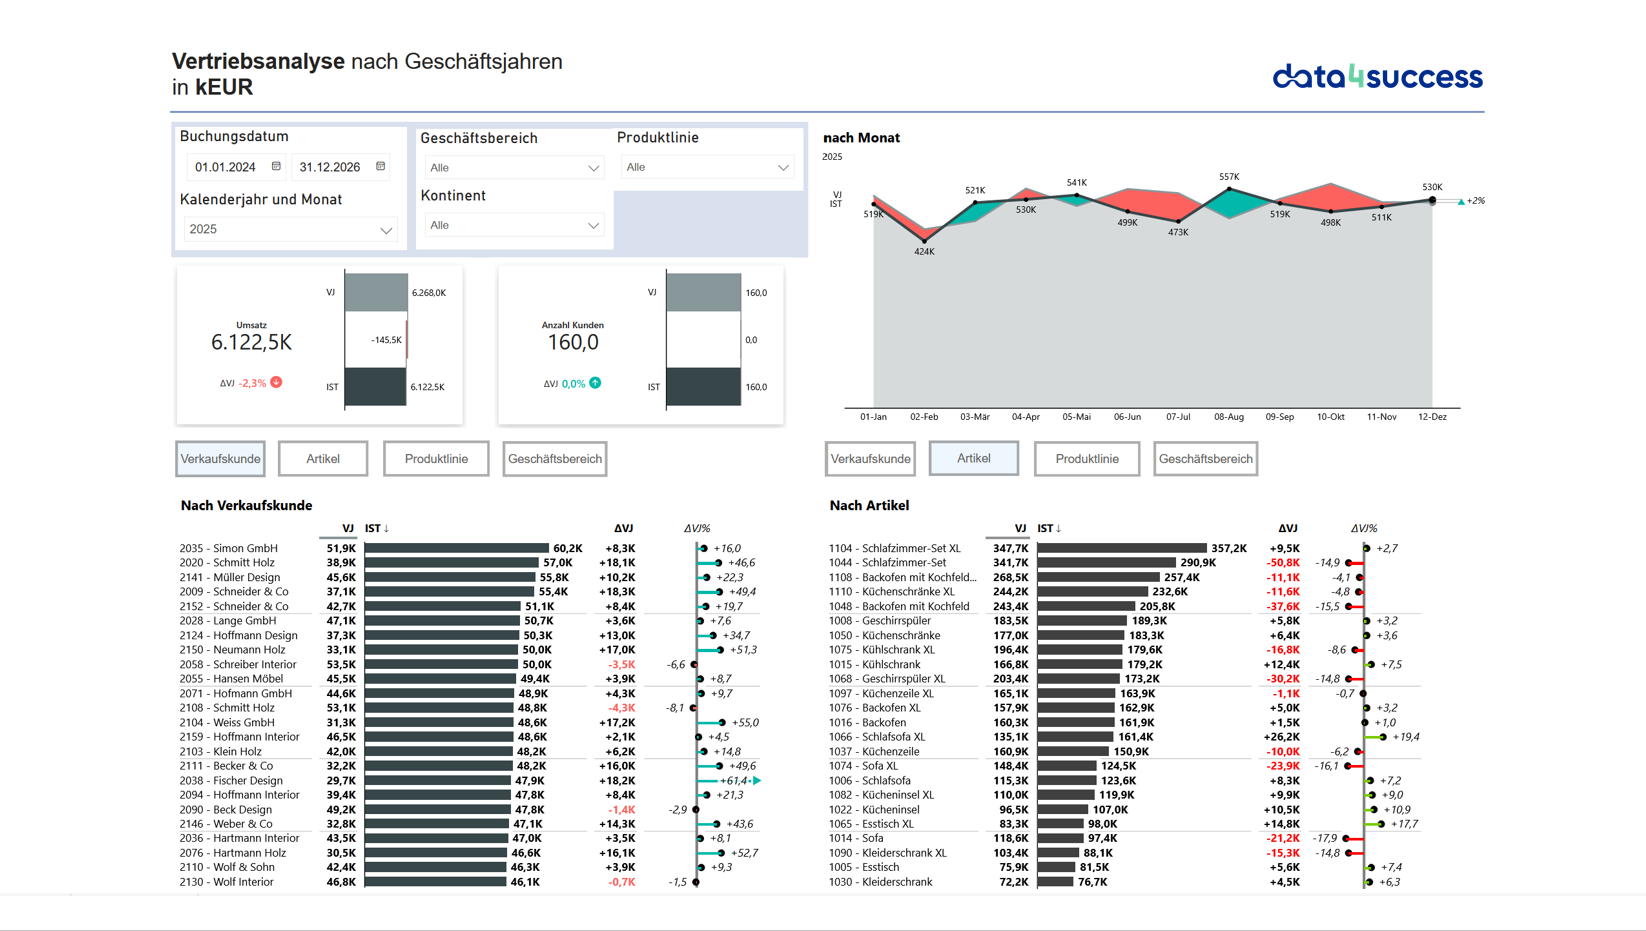
Example of a Power BI sales report with sample data. Click on the report to enlarge it.
Analyze purchase orders and blanket purchase orders by supplier, quantity, price, and status.
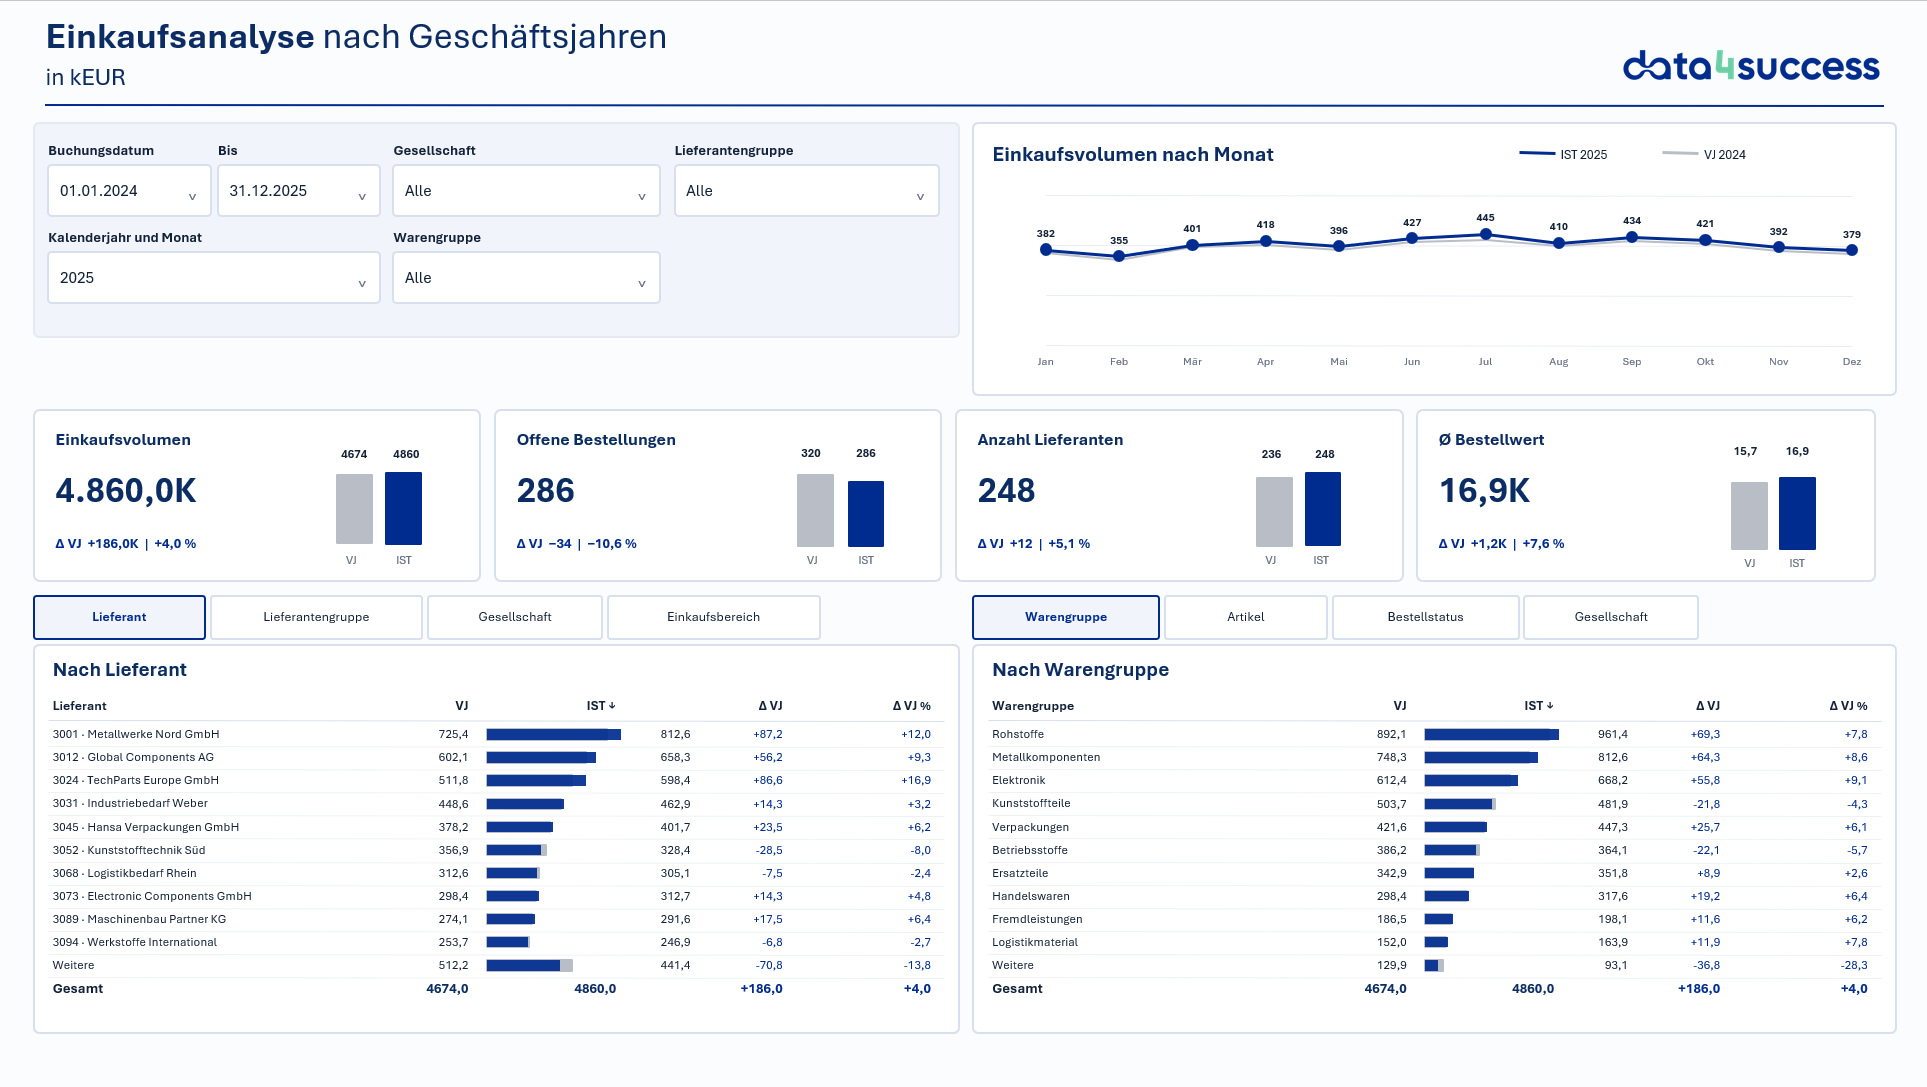
Example of a Power BI purchasing report with sample data. Click on the report to enlarge it.
Analyze inventory quantities, inventory values, and goods movements by item, variant, location, and other dimensions.
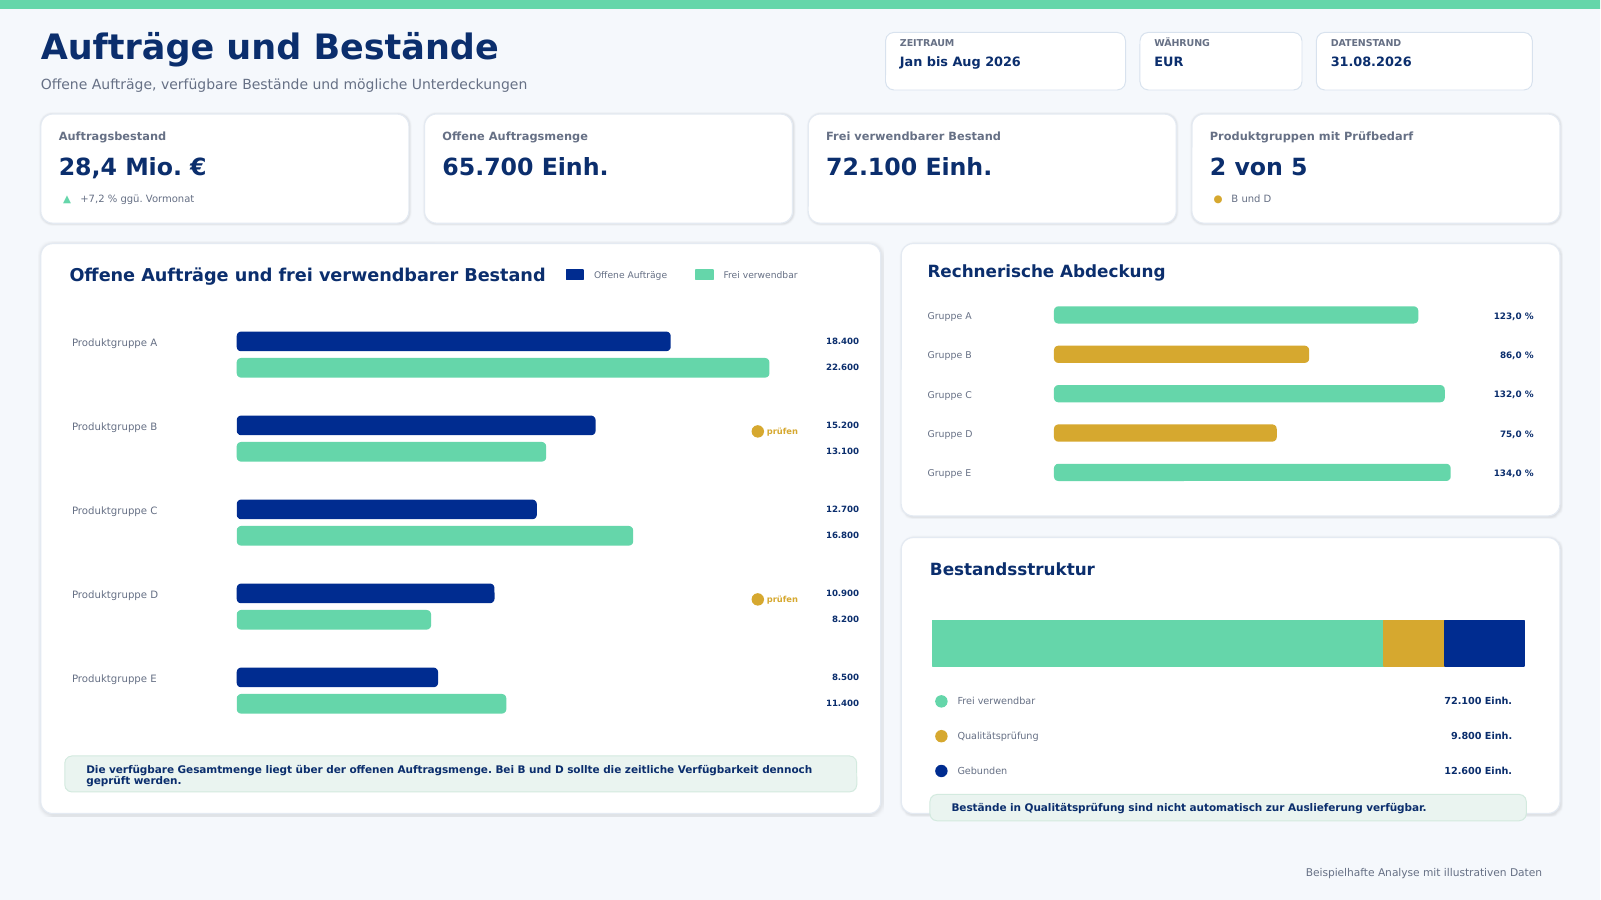
Example of a Power BI inventory report with sample data. Click on the report to enlarge it.
Evaluate production orders, planned and actual quantities, as well as material requirements and availability, based on a common framework.
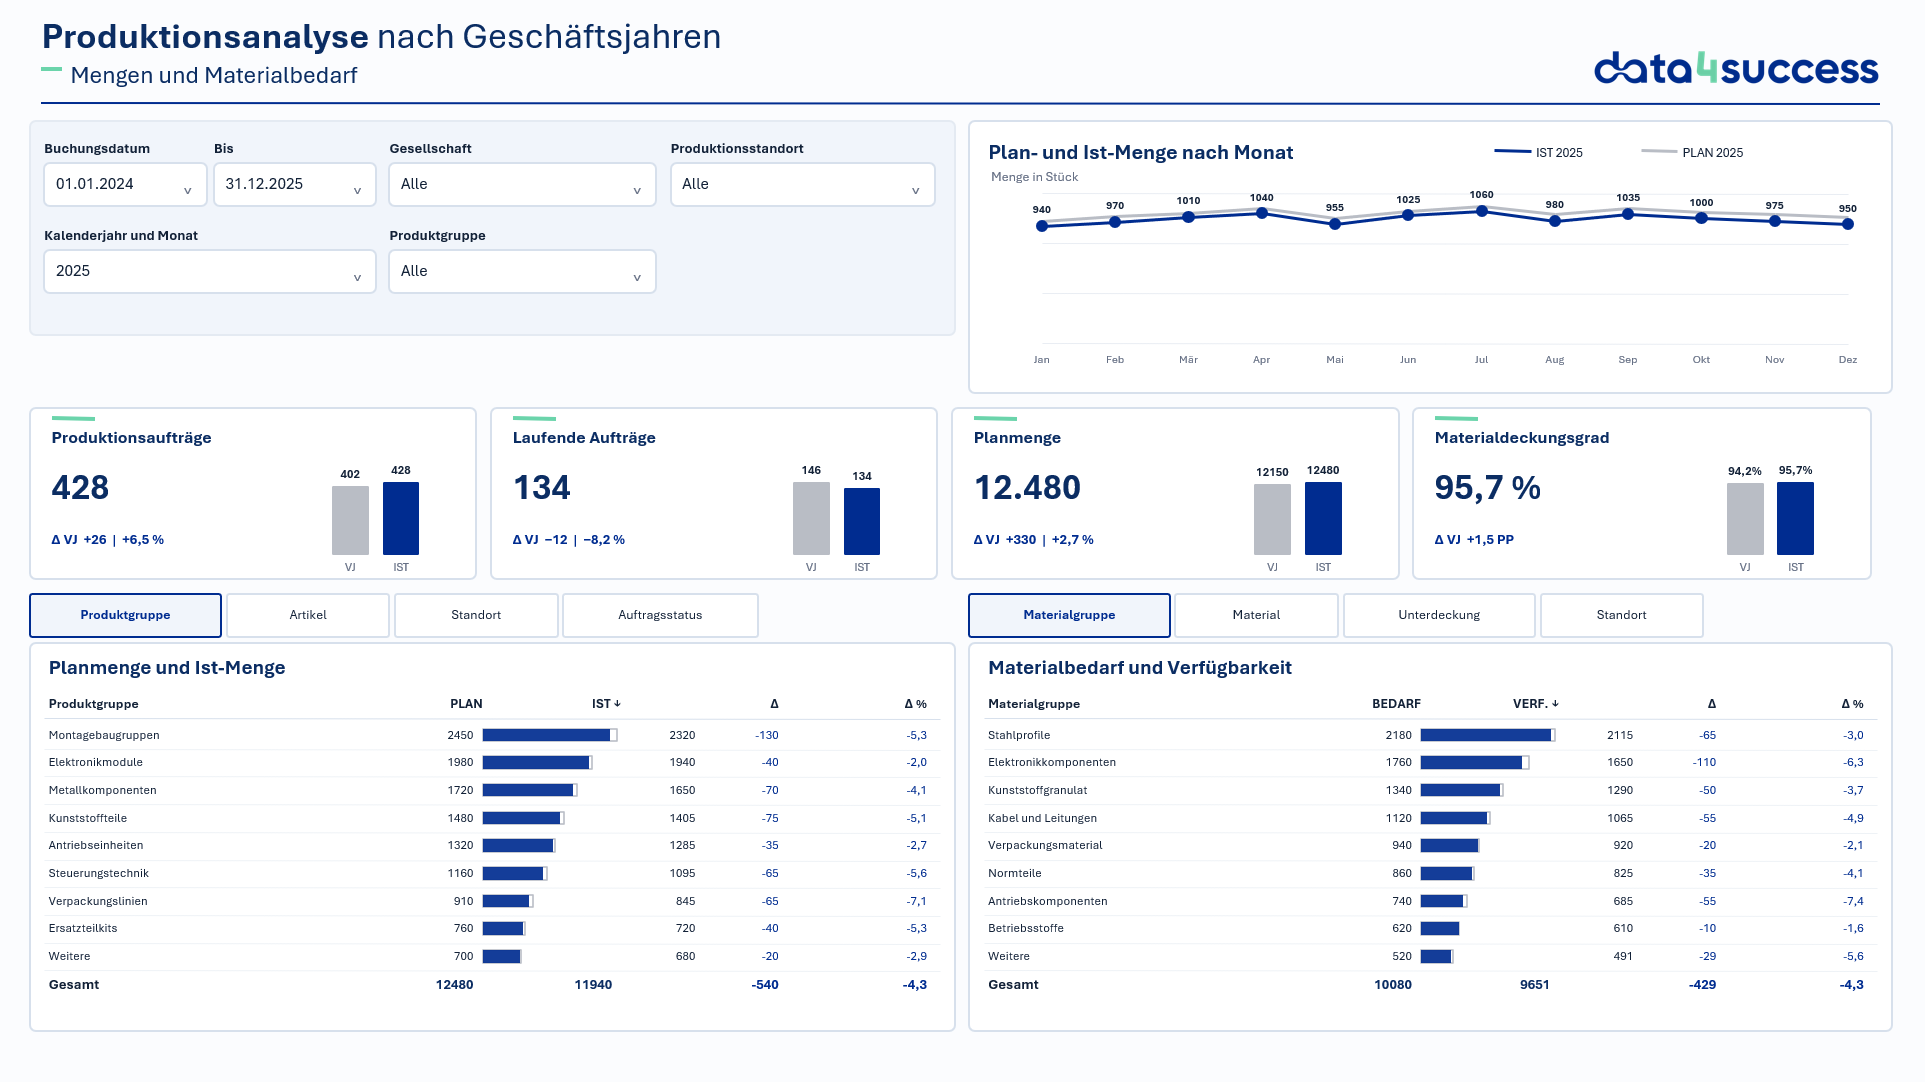
Example of a Power BI production report with sample data. Click on the report to enlarge it.
Analyze planned values, current actual data, and forecasts together. Driver-based planning models and planning data from other systems or files can also be included in this process.
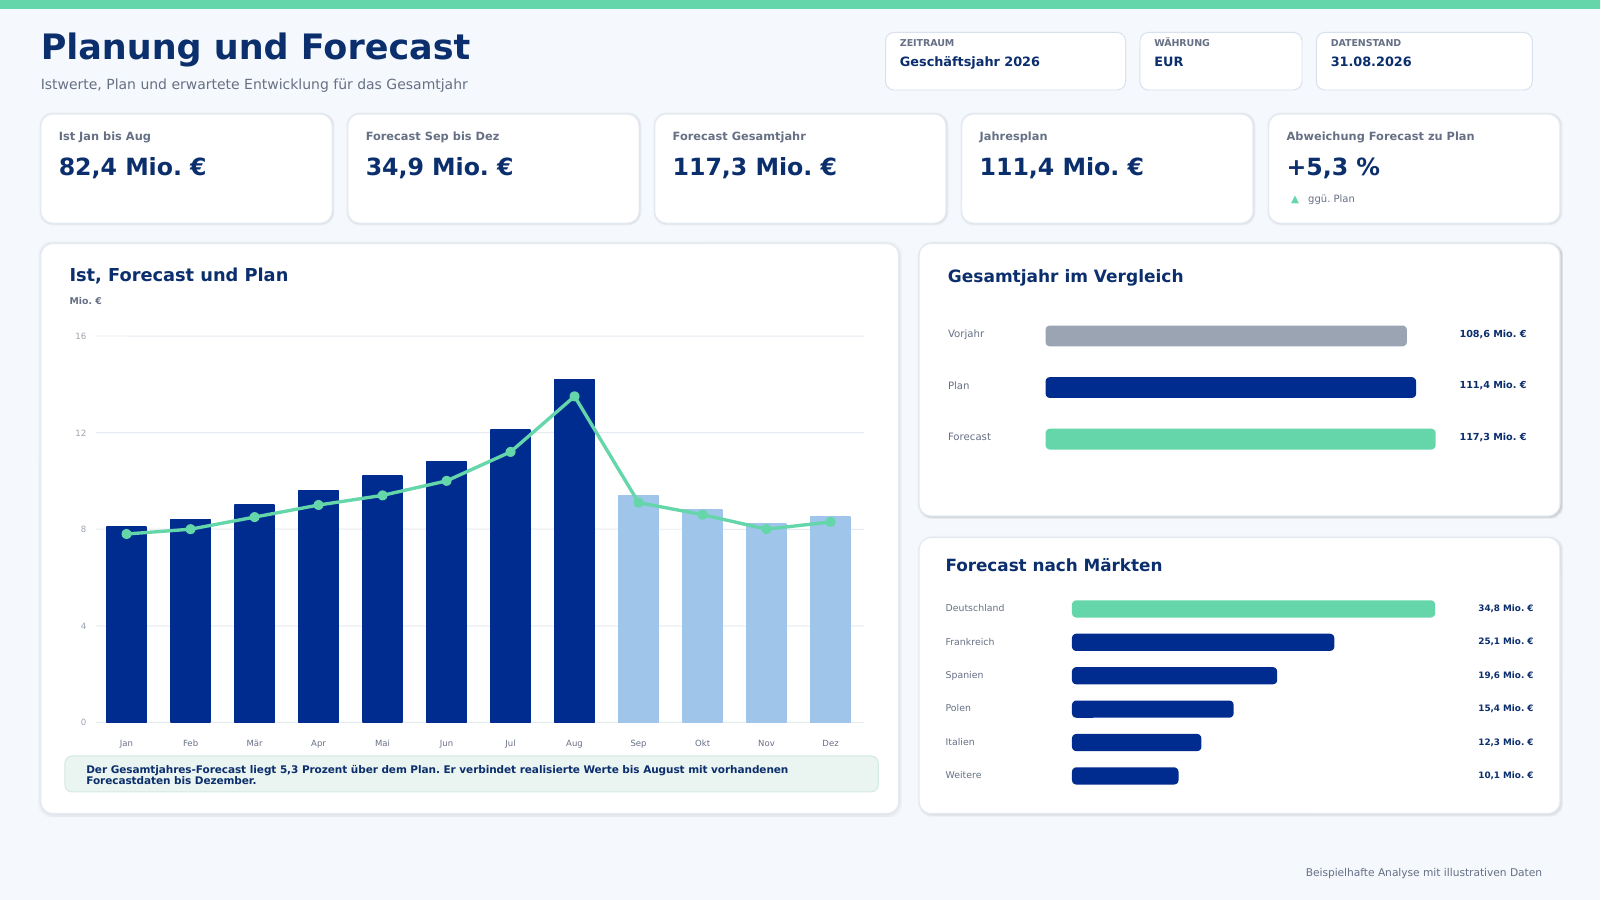
Example of a Power BI planning report with sample data. Click on the report to enlarge it.
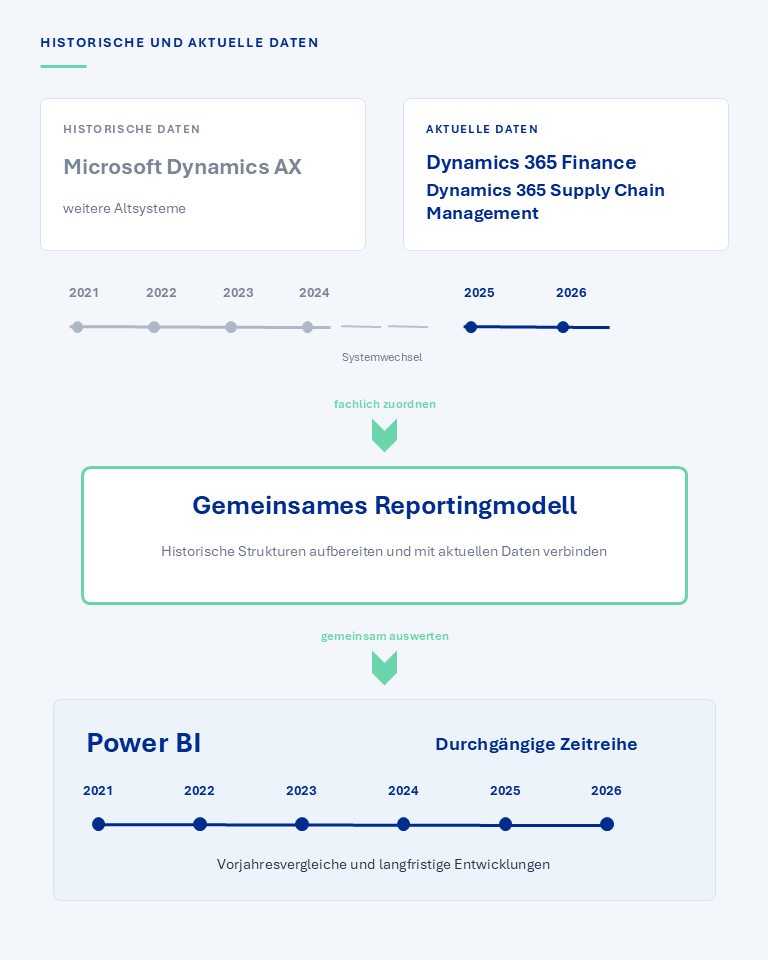
When migrating from Microsoft Dynamics AX or other ERP systems to Microsoft Dynamics 365 Finance & Operations, historical transaction data is not always fully transferred to the new operational environment. However, this information remains relevant for year-over-year comparisons, long-term trends, and existing key performance indicators.
We process historical data in a technical manner, map it to the structures of the new D365 environment, and integrate it with the current data in a unified reporting model. This enables end-to-end Power BI analyses without having to transfer the complete history into the operational ERP system.
Microsoft Dynamics 365 Finance & Operations serves as a central data source for reporting. For company-wide analyses, D365 F&O data is made available in Microsoft Fabric, modeled according to business requirements, and, if necessary, linked to planning data, historical data, and other enterprise systems.
Using Dataverse and Link to Fabric, relevant D365 F&O data can be made available in Microsoft OneLake for further processing. Building on this, harmonized data models, metrics, and permissions are created for Power BI and other data processes.
A shared database for current, historical, and supplementary company data.
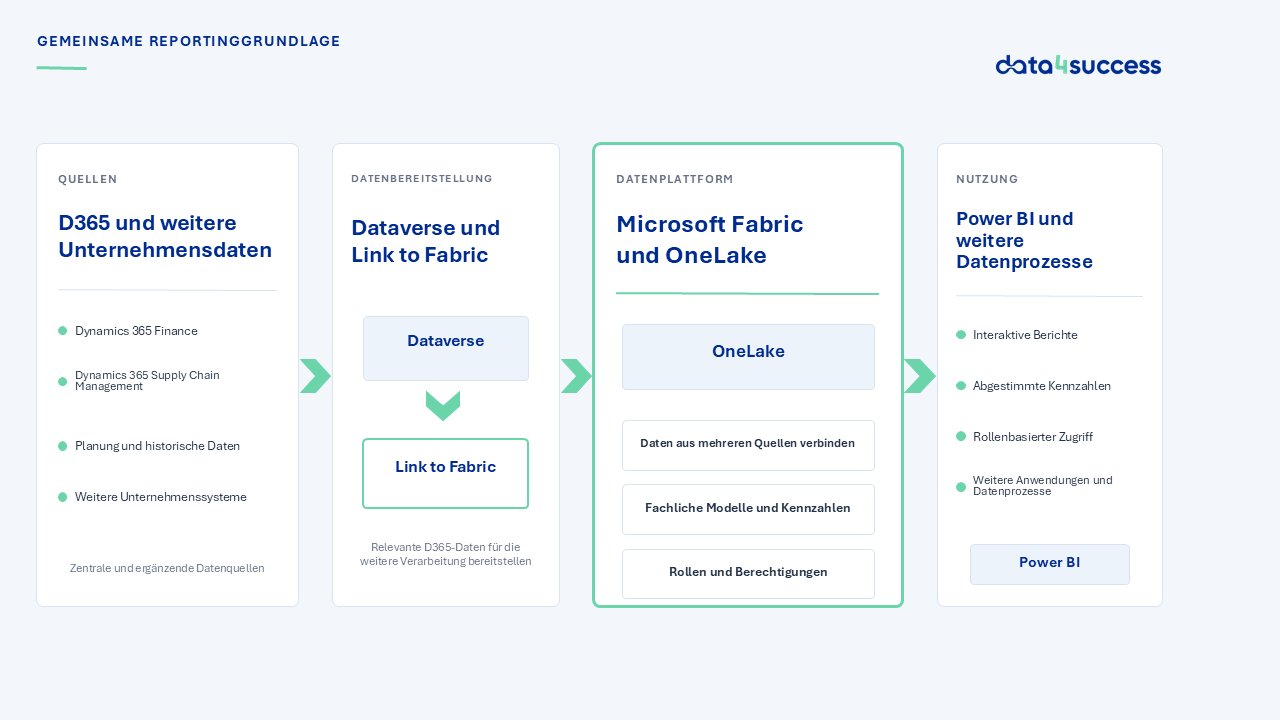
Business data is often maintained in multiple systems and processed separately for specific purposes. Microsoft Fabric provides a common foundation that connects D365 data with planning data, historical information, and data from other enterprise systems.
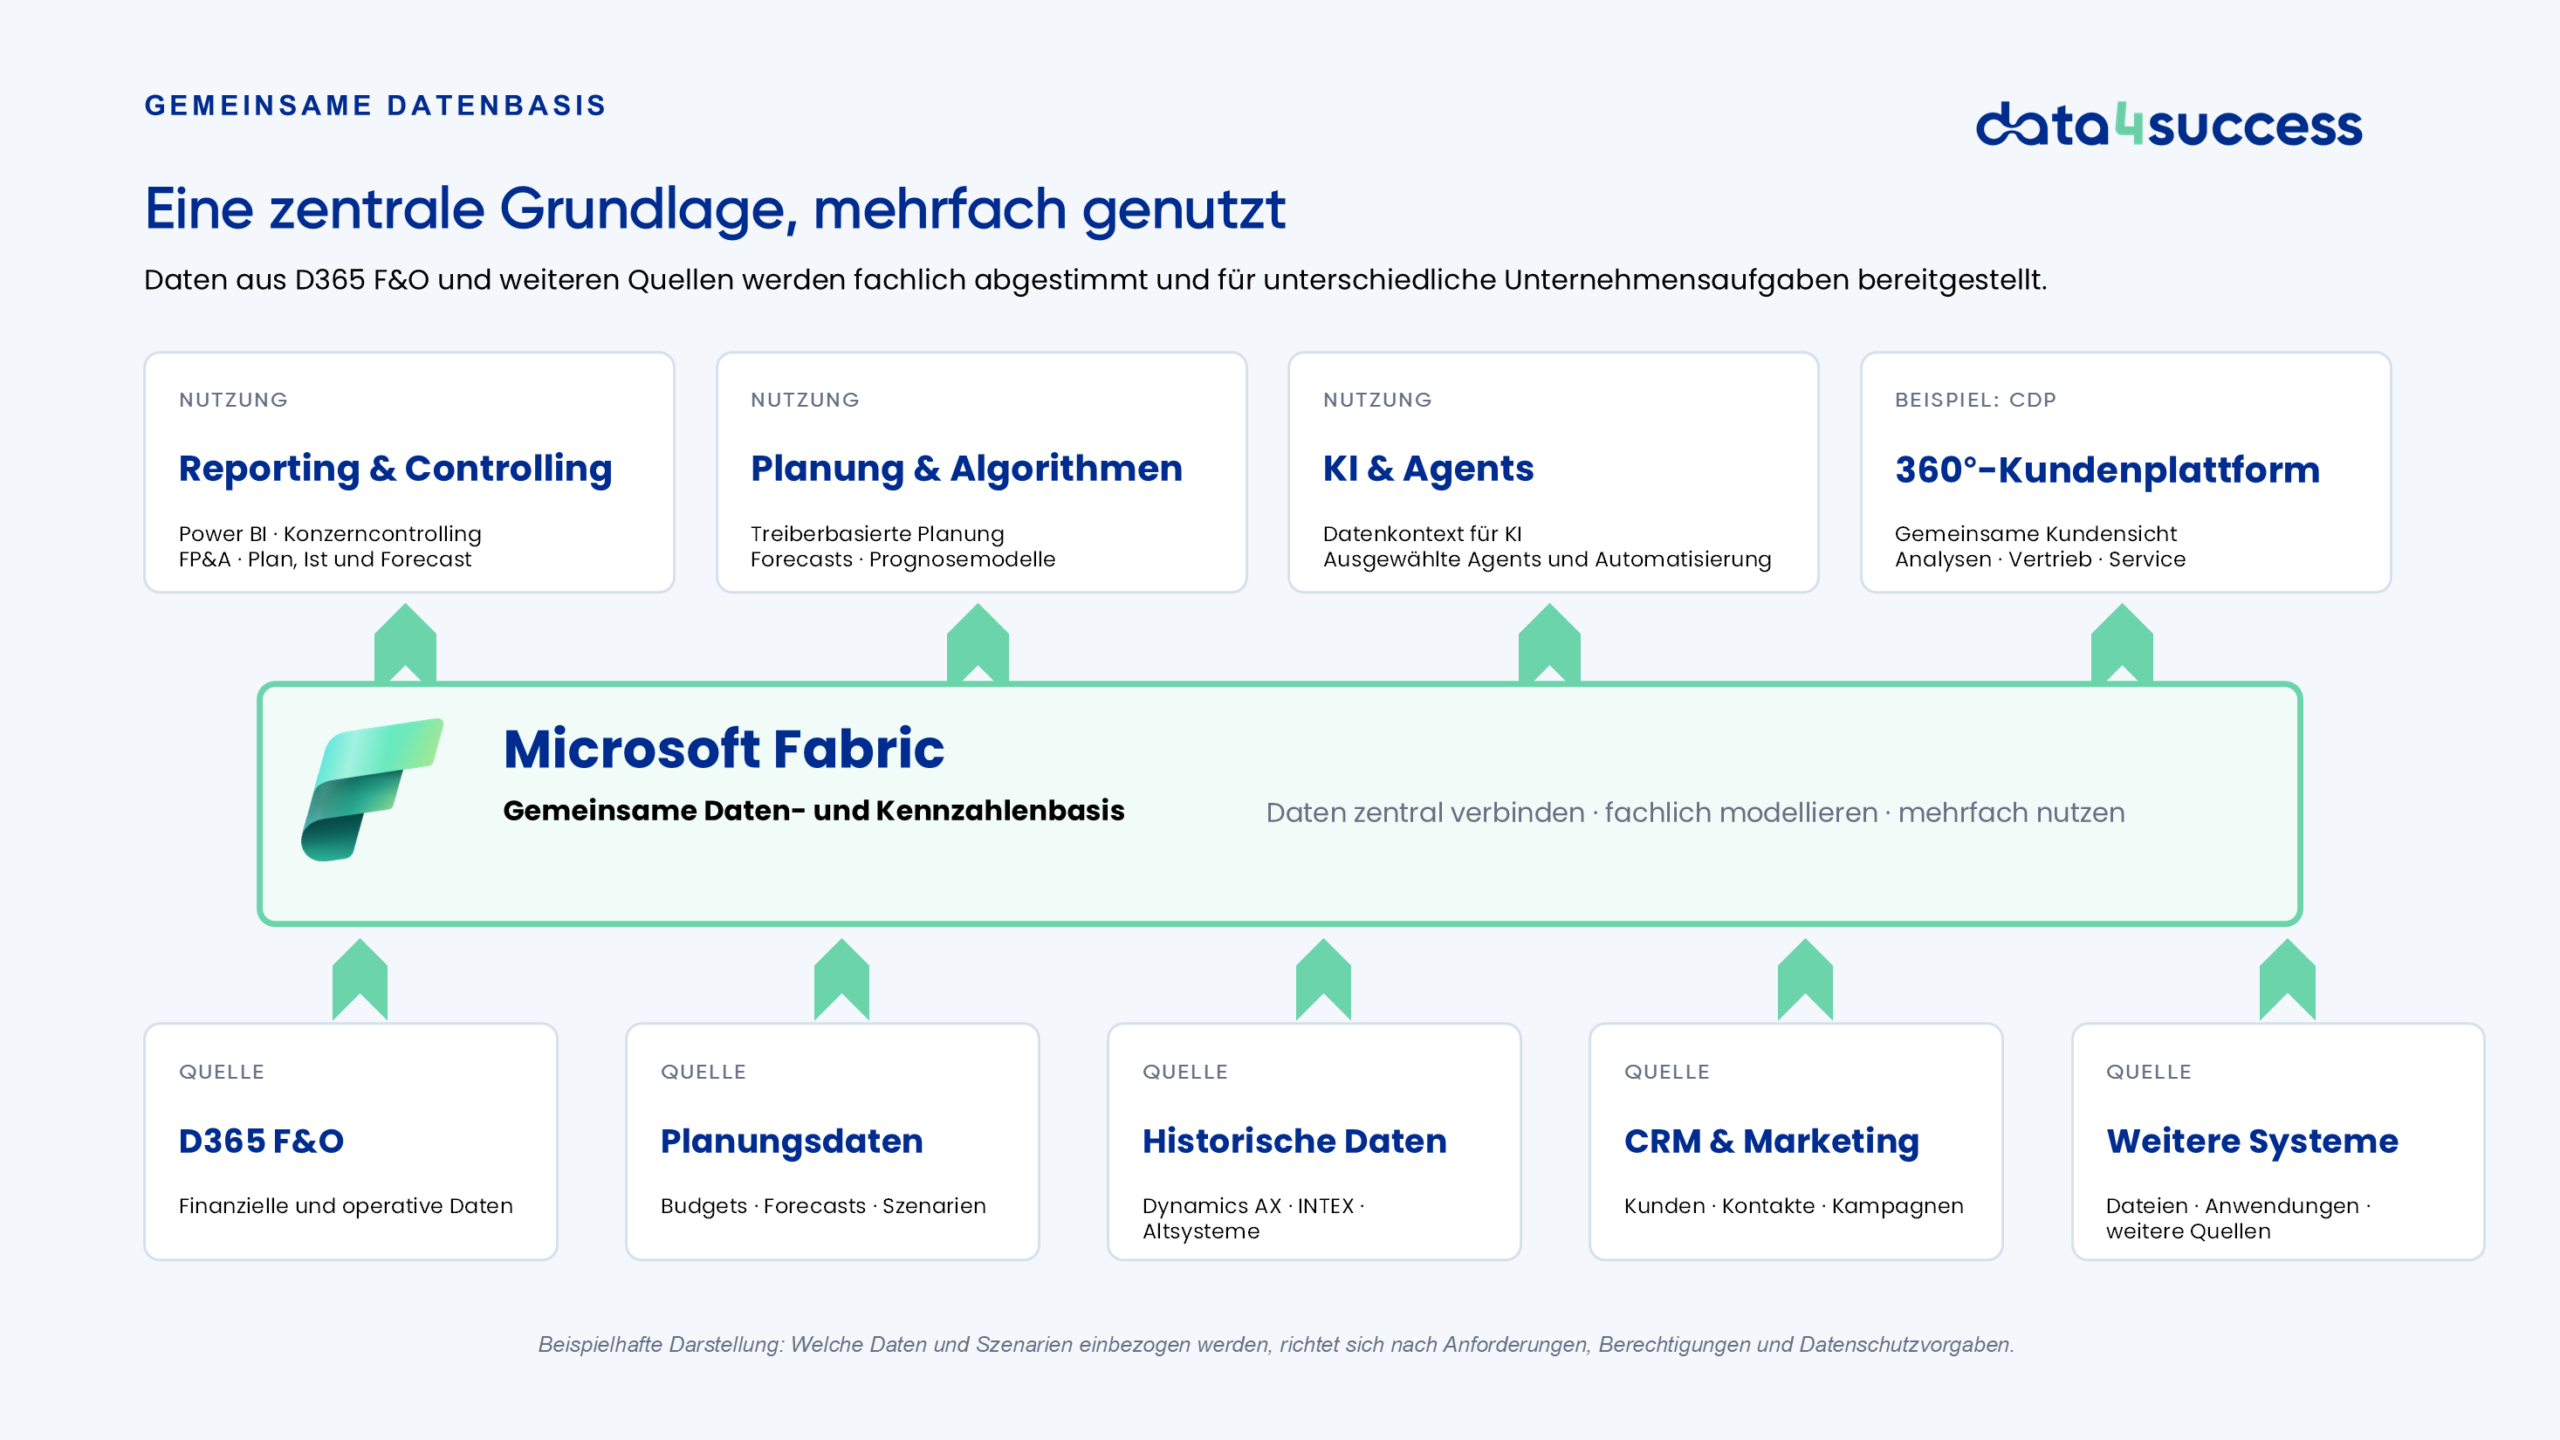
A shared database provides the foundation for consistently consolidating data and reusing it for various business tasks.
One possible application is a 360° customer platform. When customer-related information from D365 F&O, CRM, marketing, service, and other touchpoints is consolidated on a common foundation, it creates a consistent view of customers and business relationships. Such a Customer Data Platform (CDP) can support customer analytics, sales management, service processes, and select AI applications.
Every D365 F&O environment, every metric, and every business question comes with its own set of requirements. That’s why we work with you to develop the reporting framework—from clarifying business questions to implementing and refining the solution.
Together, we'll determine which decisions need support, which analyses are already available, and where additional transparency is needed.
We review the relevant D365 data, financial dimensions, companies, and supplementary sources. Together, we agree on definitions, time periods, and calculation rules.
The required data is provided, processed according to technical specifications, and integrated into a coordinated model. Historical data and other enterprise systems can also be incorporated into this process.
The necessary reports and key metrics are generated based on the shared model. Results and visualizations are jointly validated using specific use cases.
Even after the initial implementation, we continue to provide support for updates, access issues, knowledge transfer, and the gradual refinement of the reporting system.
The appropriate reporting framework for D365 F&O is derived from specific business questions, agreed-upon metrics, and a data foundation developed in stages.
The specific implementation depends on your D365 F&O environment, the available data, and the desired reports. Answers to frequently asked questions about data provision, architecture, and usage can be found in the following section.
Financial and operational data from D365 F&O can be used for reporting. This includes data from the closely integrated applications Dynamics 365 Finance and Dynamics 365 Supply Chain Management. For example, general ledger data, financial dimensions, sales and purchasing documents, inventory, production orders, projects, and other master and transaction data can be analyzed. The specific scope depends on the D365 environment, the modules used, and how the data is made available.
Yes. Depending on the existing system landscape, D365 F&O data can be linked, for example, to planning data, historical data from legacy systems, CRM information, Excel files, or data from other enterprise systems. This creates a common reporting foundation for aligned key metrics and cross-system Power BI analyses. Which sources are included depends on the business requirements and the specific data availability.
Yes. Historical data from Microsoft Dynamics AX, INTEX, or other legacy systems can be processed, mapped to the structures of the new D365 F&O environment, and analyzed alongside current data. This allows for year-over-year comparisons and analysis of long-term trends without having to migrate the entire history into the operational system.
Yes. Data from multiple companies can be consolidated into a single reporting model and analyzed by company, time period, currency, or financial dimension. This enables the creation of both company-specific reports and cross-company comparisons. The necessary consolidation and comparison logic is tailored to each specific project.
The timeliness of the data depends on the selected data delivery method, the volume of changes, and the specific D365 F&O environment. With Link to Fabric, changes from Dataverse can be made available in Microsoft Fabric on an ongoing basis. For selected use cases, relevant data can be made available with a delay of approximately two to five minutes and analyzed in near real time. The fully integrated reporting foundation, on the other hand, can be updated at different intervals. The level of timeliness that is appropriate and technically feasible for Power BI reporting is determined based on data volumes, tables, and business requirements.
Microsoft Fabric can be launched with even a small capacity tier. The starting price is currently around 170 euros per month per company, not per user. The actual costs depend, among other factors, on the region, contract, and billing model. Storage and Power BI license costs may also apply. As demand grows, capacity can be scaled flexibly.
Access and permissions are configured according to user groups and the reporting strategy. In Power BI, different access rights can be configured for reports, workspaces, and data models. Role-based data views also ensure that users see only the data intended for them. The specific configuration is tailored based on existing authorization structures and business requirements.
Analyze sales, customers, products, and trends in an interactive Power BI report.
Gain insight into your income statement, balance sheet, and financial metrics in a single, consolidated report.
The standard reports are each available as a starter package for 3,000 euros plus license fees. Once the necessary access credentials have been provided, implementation typically takes place within two weeks.
The technical implementation depends on the existing D365 F&O environment and the appropriate architecture. Together, we will determine how the data required for the standard report can be provided and regularly updated.
The Fabric Starter Package is available for 2,000 euros. It includes the initial setup of the Fabric architecture, integration of D365 F&O data, configuration of automated data-loading processes, and a personalized introduction.
Our billing processes are intentionally designed to be streamlined so that only the fabric capacity that is actually needed is used. For many entry-level scenarios, even a small capacity tier may be sufficient. The starting price is currently around 170 euros per month per company, not per user. The actual costs depend, among other factors, on the region, contract, and billing model.
License fees for Power BI, Zebra BI, and, if applicable, Microsoft Fabric are not included.
If there are multiple companies, special system configurations, or non-standard data structures, the effort required to provide and prepare the data may vary. In such cases, we assess the initial situation in advance and tailor the scope of our services to your specific needs.
Whether it’s revenue trends, margins, inventory levels, or comparisons of plans, actuals, and forecasts: Together, we’ll review your existing data and analyses and develop a reporting framework that aligns with your business needs and your D365 F&O environment.