
Reporting for Sage 100 with Power BI
for transparent and flexible analyses.
Sage 100 serves as a central hub for much of your company’s key information. However, as soon as reports span multiple departments, track specific metrics, or need to be regularly provided to various recipients, individual lists and manual exports are often no longer sufficient.
With a Power BI solution tailored to Sage 100, we make your existing data available for structured analysis. This results in reporting that aligns with your processes and information needs.
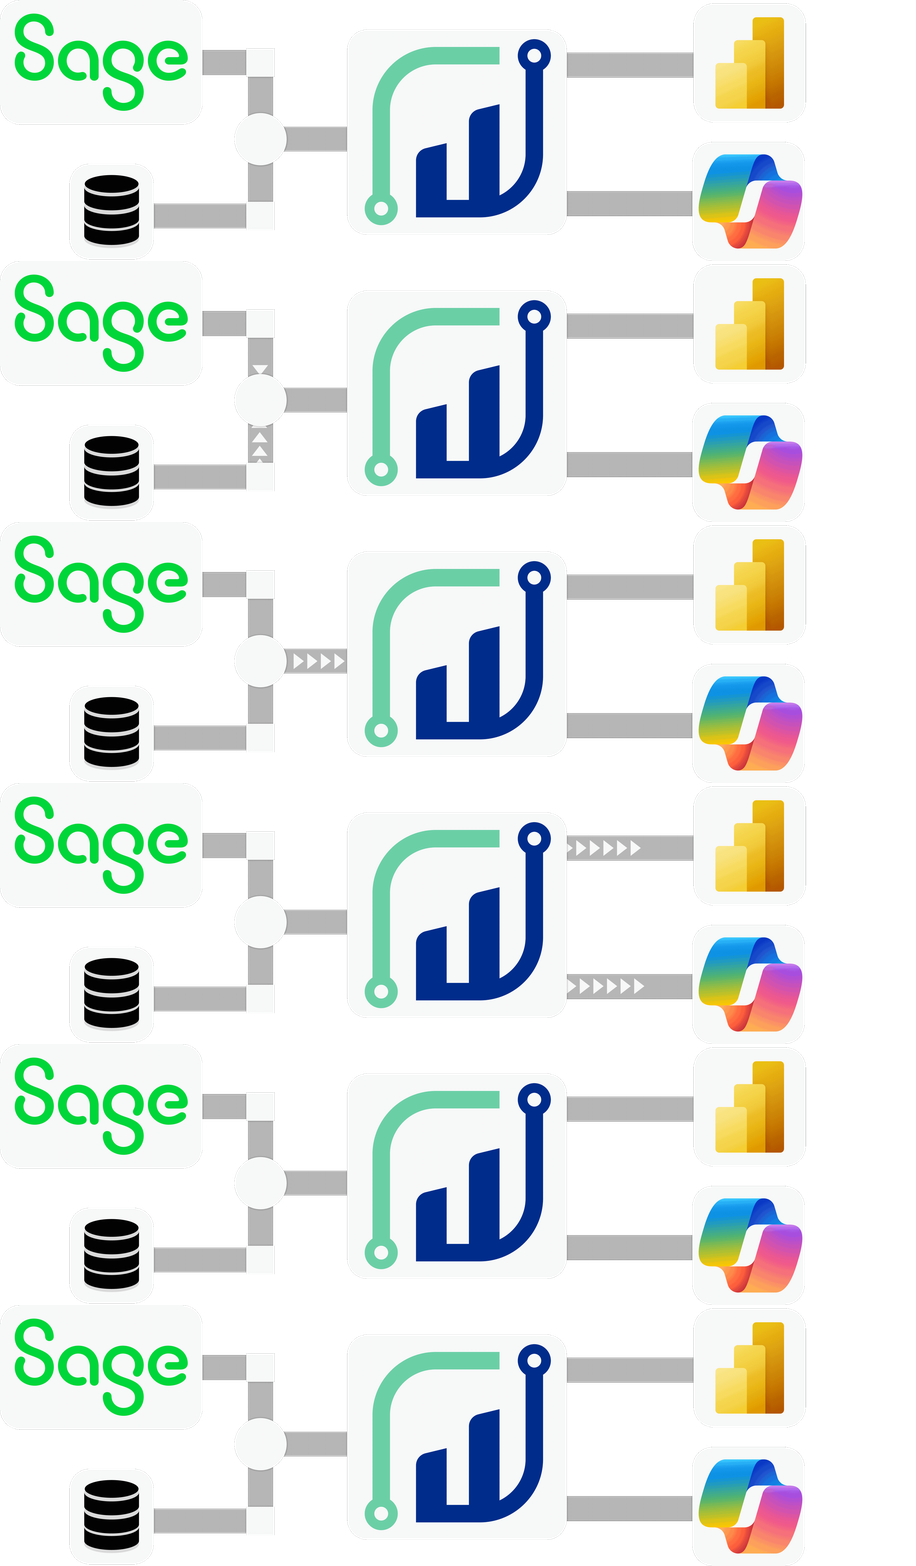
Your information is already on file.
What matters is how you use them.
Warehouse
Shopping
Distribution
Production
Finance
Sage 100 supports key business and operational processes. This means that information on customers, items, orders, inventory, suppliers, and transactions is generally available within the company.
In day-to-day operations, a great deal of information is viewed directly in Sage 100 through lists and existing reports. This makes it easy to answer specific operational questions. However, as soon as multiple areas need to be analyzed together, trends over longer periods need to be examined, or customized metrics need to be provided for different recipients, the demands on data preparation and reporting increase significantly.
This often results in additional Excel files, manually maintained reports, or different calculations for the same metric. The workload increases, and it becomes more difficult to maintain a consistent and transparent view of the numbers.
This is exactly where supplemental reporting with Power BI comes in.
Common Challenges in Reporting with Sage 100
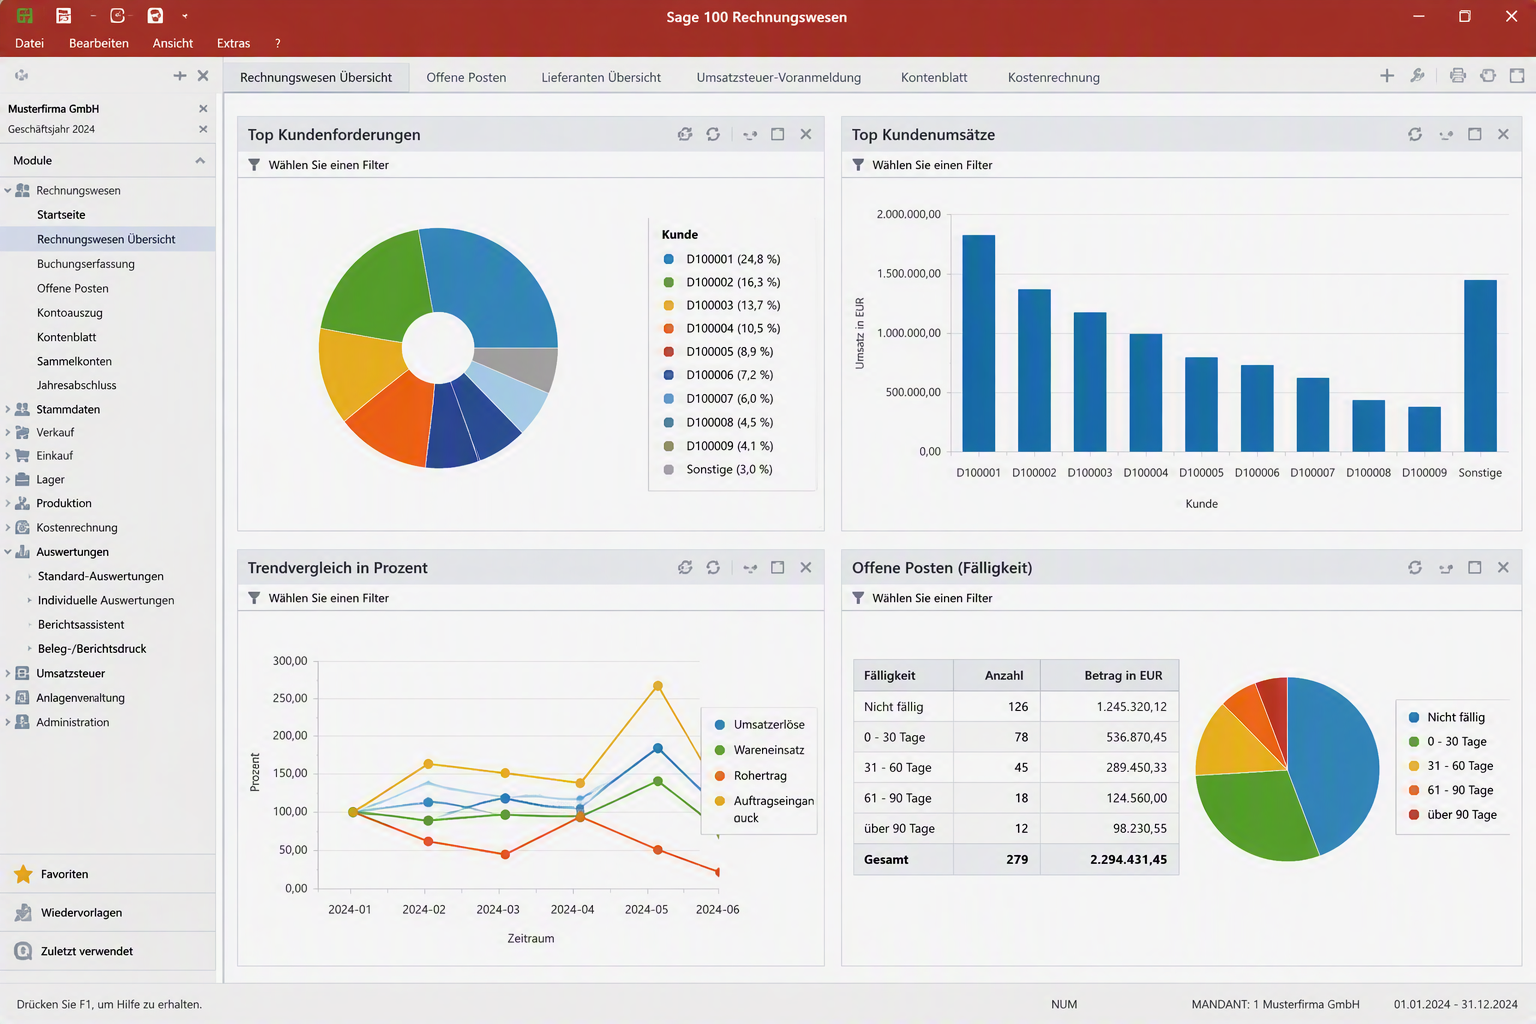
Sage 100 provides a wealth of information through analyses, lists, reports, and overviews, such as open items, customer sales, and financial data. However, challenges often arise when information from multiple areas needs to be consolidated, key metrics need to be defined consistently, or analyses need to be provided regularly to different recipients.
Reports in Sage 100
Advanced Analysis with Power BI
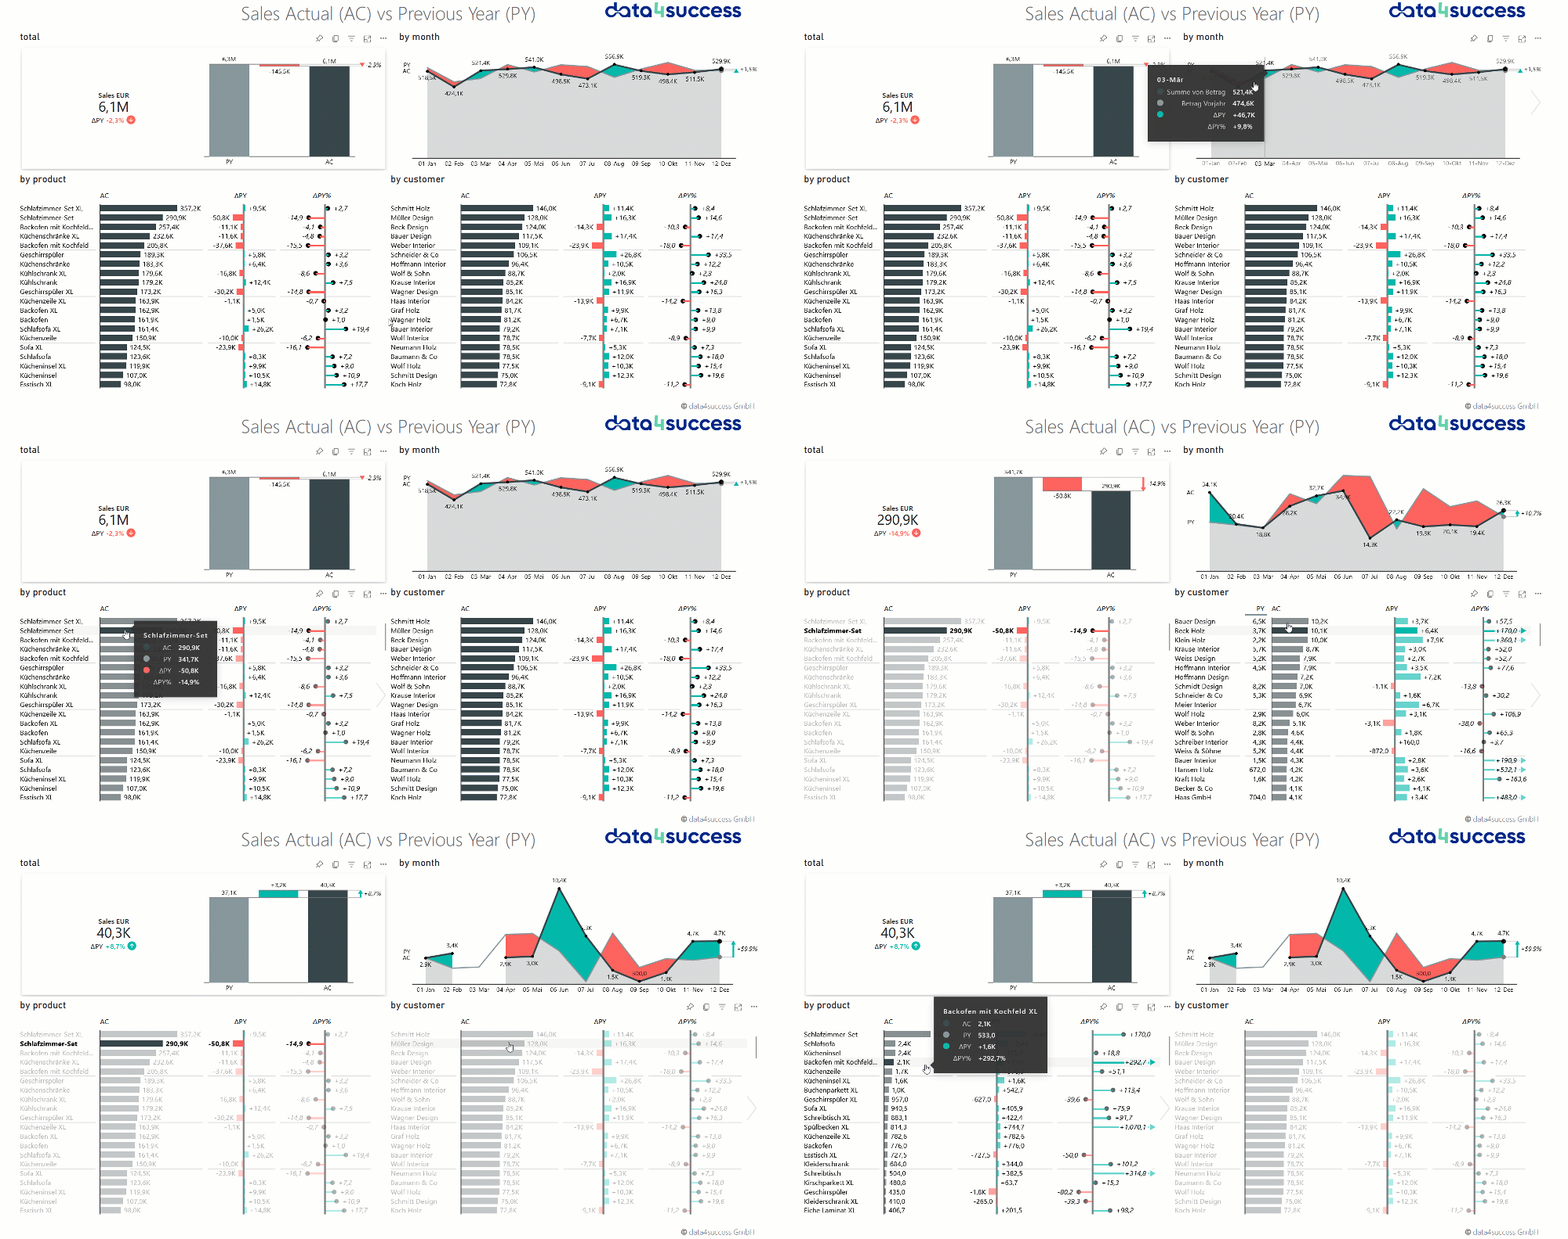
Combining data from multiple areas
Many business questions cannot be answered using information from just one area. For a meaningful margin analysis, for example, sales data, purchase prices, product information, and other cost components may be relevant.
Reduce Repetitive Manual Work
If reports need to be exported, updated, and recombined on a regular basis, this creates unnecessary work. At the same time, it increases the risk that different versions of a report will be in circulation.
Define Key Metrics Consistently
Terms such as revenue, margin, order backlog, and reach may seem straightforward at first glance. In practice, however, different filters, time frames, and calculation methods can lead to varying results.
Enabling Different Perspectives
Management, Controlling, Sales, Purchasing, and Warehousing do not all require the same view. A shared data foundation should therefore enable different perspectives without requiring a completely new analysis for every question.
Flexibly Analyze Data from Sage 100 Using Power BI
We organize the Sage data relevant to your reporting in a structured manner and consolidate it into a transparent data model. Based on this, we develop Power BI reports that reflect your business needs and existing processes.
Evaluate Sales Performance Transparently
Analyze revenue, sales volume, prices, and margins by time period, customer, item, or product group. This makes it easier to identify trends and variances.
- Revenue Trends by Time Period
- Comparison of Customers and Items
- Analysis of Sales, Prices, and Margins
- Overview of the Order Backlog
- Trends among individual customers or product groups
Analyze Purchasing in a Targeted Manner
Analyze purchase volumes, prices, delivery times, and terms by supplier, item, or time period. This allows you to identify trends and deviations early on.
- Purchasing Volume by Supplier
- Trends in Purchase Prices
- Discrepancies Between Orders and Goods Received
- Analysis of Delivery Times and Delivery Reliability
- Comparison of Products and Terms
Keep Track of Inventory and Items
Analyze inventory levels, inventory movements, and safety stock by item, product group, or time period. This allows you to quickly identify inventory trends, tied-up capital, and critical items.
- Inventory and Inventory Trends
- Analysis of Inventory Movements
- Reach by Article or Product Group
- Identification of slow-moving or critical items
- ABC and XYZ Analyses
Analyze Financial Data in a Structured Manner
Analyze journal entries, account balances, and cost centers by time period, account, or organizational unit. This allows you to clearly illustrate financial trends and variances.
- Entries and Account Balances
- Reports by Cost Center
- Analysis of Open Items
- Comparisons Across Periods
- Plan-Actual Comparisons Using Existing Plan Data
Analyze Production Data in a Traceable Manner
Provided that the relevant production data is available in Sage 100, production orders, bills of materials, and work centers can be viewed together. This makes it easier to analyze quantities, material consumption, and variances.
- Overview of Production Orders
- Analysis of Bills of Materials
- Reports by Work Step
- Analysis of Material Consumption
- Comparison of Quantities and Variances
Distribution
Evaluate Sales Performance Transparently
- Revenue Trends by Time Period
- Comparison of Customers and Items
- Analysis of Sales, Prices, and Margins
- Overview of the Order Backlog
- Trends among individual customers or product groups
Shopping
Analyze Purchasing in a Targeted Manner
- Purchasing Volume by Supplier
- Trends in Purchase Prices
- Discrepancies Between Orders and Goods Received
- Analysis of Delivery Times and Delivery Reliability
- Comparison of Products and Terms
Inventory and Items
Keep Track of Inventory and Items
- Inventory and Inventory Trends
- Analysis of Inventory Movements
- Reach by Article or Product Group
- Identification of slow-moving or critical items
- ABC and XYZ Analyses
Finance and Controlling
Analyze Financial Data in a Structured Manner
- Entries and Account Balances
- Reports by Cost Center
- Analysis of Open Items
- Comparisons Across Periods
- Plan-Actual Comparisons Using Existing Plan Data
Production
Analyze Production Data in a Traceable Manner
- Overview of Production Orders
- Analysis of Bills of Materials
- Reports by Work Step
- Analysis of Material Consumption
- Comparison of Quantities and Variances
More than just a single report
A good reporting solution consists of more than just clear charts. It is crucial that calculations are transparent and that various analyses are based on a common technical foundation.
Power BI then serves as the front end. Users can filter information, analyze trends, and drill down from an overview to the relevant details. Sage 100 remains the operational source system. The supplementary reporting provides an additional perspective on the existing data.
Sage 100 and Other Sources
ERP data, planned values, CRM data, Excel files, or other operational applications
Shared Database
Structured relationships and uniformly defined key performance indicators
Power BI Reports
Interactive analyses for different departments and perspectives
Here's how we handle your Sage reporting
Every reporting solution starts with specific questions, existing analyses, and the relevant system environment. Together, we determine what information is needed and how this can be used to create a suitable reporting structure.
Understanding the Initial Situation
Review Data and Key Metrics
Develop a database and data model
Implementing Power BI Reports
Integrating Reporting into Day-to-Day Work
Experience with ERP data and reporting
data4success specializes in business intelligence, data models, and reporting solutions for medium-sized companies. We focus not only on the visible reports, but also on the data structures, business relationships, and calculation logic that form the foundation of reliable reporting.
Our team has hands-on experience with Sage data, Microsoft SQL Server, data migrations, data models, and Power BI. This enables us to take into account both the technical data infrastructure and the business requirements of future users.
Understanding ERP Data
We analyze existing data structures and identify the information needed for the desired analyses.
Building Data Models
We organize data in a structured manner and present technical relationships and calculation logic in a way that is easy to understand.
Implement Reporting
We develop Power BI reports that meet the information needs of the intended users and departments.
Frequently Asked Questions About Reporting with Sage 100
Here you'll find answers to frequently asked questions about analyzing Sage 100 data with Power BI and designing a suitable reporting solution.
Can Sage 100 be analyzed using Power BI?
In general, data from Sage 100 can be prepared for analysis using Power BI. The data that is available and how it is provided depend on the version being used, the modules in use, and the existing system environment. Therefore, we will first examine the specific initial situation and the desired metrics.
Can older versions of Sage also be analyzed?
Yes. Older versions of Sage can also be used for Power BI analyses. Provided the relevant data is available, existing ERP data can be integrated into a modern reporting solution and analyzed. A system change is not required for this.
Do existing reports need to be completely replaced?
No. A new reporting solution can be implemented in phases. Existing reports can initially serve as a technical foundation and be supplemented or replaced in areas where there is currently a particularly high amount of manual work or a need for reconciliation.
Can other data sources be integrated in addition to Sage 100?
Yes. If additional information is needed for an analysis, other sources can be included depending on the system environment. These may include, for example, budget figures, CRM data, Excel files, or data from other operational applications.
Are custom metrics and reports possible?
The reports and key metrics are tailored to the company's business requirements. In this process, we work together to determine which calculation logic applies and which views the various users need.
For which business areas is reporting based on Sage 100 suitable?
Depending on the modules used, areas such as sales, purchasing, warehousing, finance, management accounting, and production can be analyzed. The key is not to display as much data as possible, but to consolidate the information needed to make specific decisions.
Preconfigured Standard Reports for Sage 100
For many companies, certain analyses are particularly important. That’s why we’ve developed preconfigured Power BI reports for Sage 100 tailored to typical requirements in sales and finance. The reports include not only the visible analysis but also the data model required for it. This creates a scalable and flexibly expandable framework that can be used as a starting point for further analyses.
Sales Reporting
Analyze sales, customers, products, and trends in an interactive Power BI report.
Financial Reporting
Gain insight into your income statement, balance sheet, and financial metrics in a single, consolidated report.
The standard reports are each available as a starter package for 3,000 EUR plus license fees. Once the necessary access credentials have been provided, implementation typically takes place within 2 weeks. License fees for Power BI and Zebra BI are not included.
Would you like to get more out of your Sage 100 data?
If generating reports currently involves a lot of manual work, if it’s difficult to consolidate important information, or if there are conflicting figures circulating, it’s worth taking a closer look at your reporting structure.
We'd be happy to discuss with you what data you already have and how we can use it to develop a suitable Power BI solution.