
CONSOLIDATION AND REPORTING
Lucanet creates a common foundation for consolidated financial information from different companies and structures. We prepare the relevant data for Power BI and develop tailored financial analyses that incorporate additional approved company data as needed.
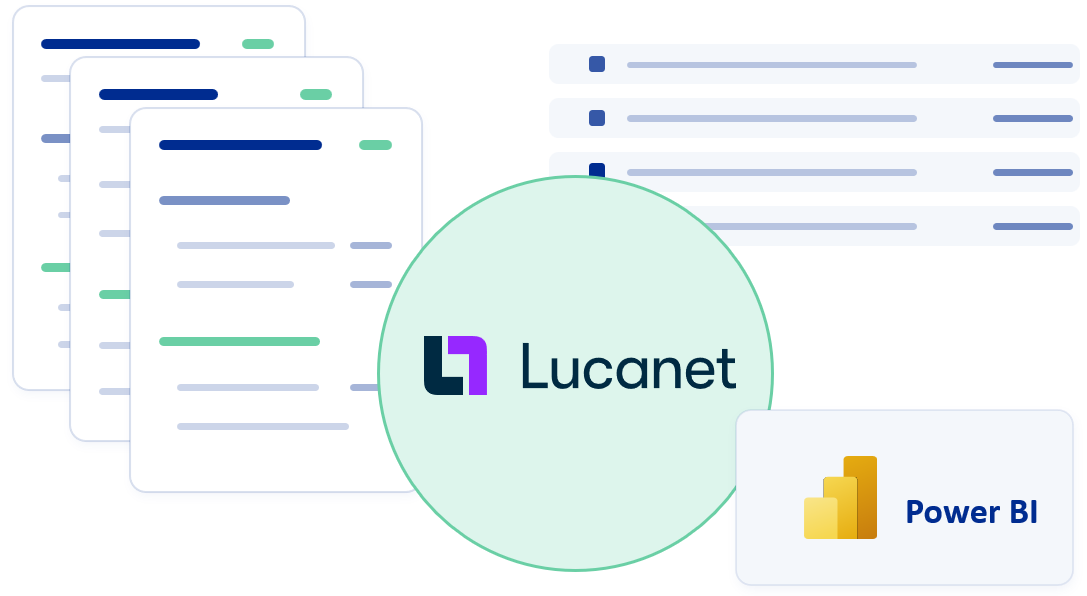
DIFFERENT FINANCIAL STRUCTURES
Subsidiaries often use different ERP and financial accounting systems. Chart of accounts, general ledger accounts, account descriptions, and local financial structures may also differ from one another. As a result, comparable business transactions are not automatically recorded and reported in the same format.
To obtain a consolidated view of the group, it is therefore not enough to simply aggregate the financial data of the individual companies. First, different accounts and financial items must be classified according to their business functions.
ERP system
Local Chart of Accounts
Financial System
Custom Account Structure
Financial Accounting
Local Names
Comparability can only be achieved through a common technical classification.
COMMON GROUP LOGIC
Accounts with different numbers or names may represent functionally comparable items. At the same time, a similar name does not automatically mean that two accounts can be treated identically in terms of content. To ensure a consistent group-wide view, local accounts must therefore be reviewed and assigned to the designated group-level accounts in a transparent manner.
The key factor is the functional significance of an account within the respective company and its intended position within the overall financial structure.
Schematic Mapping of Different Account Structures
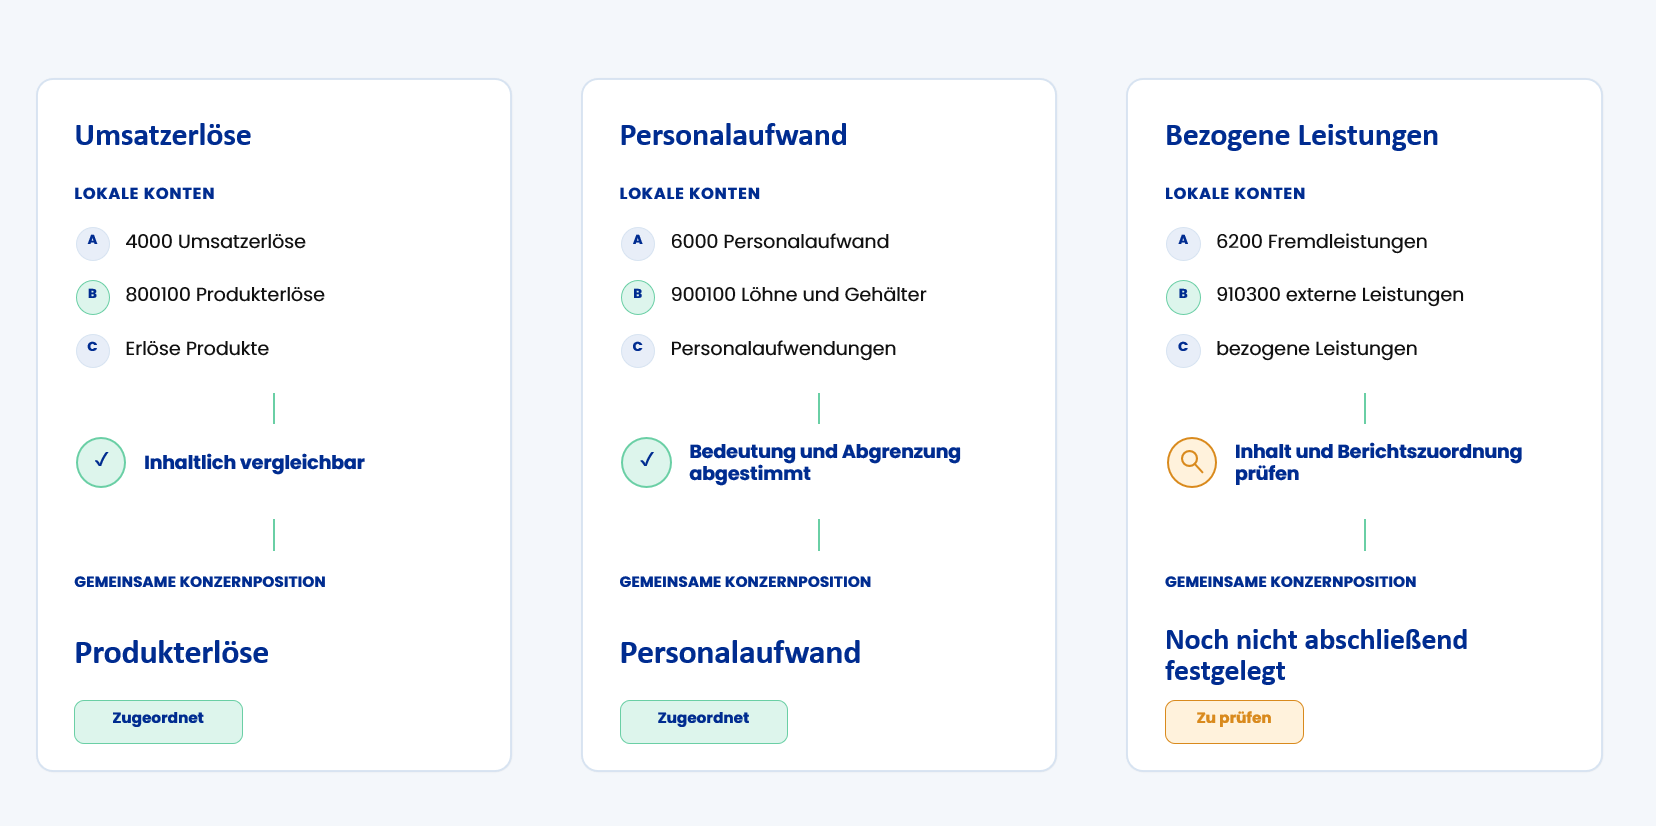
Beispiel mit fiktiven Konten und Bezeichnungen.
Account mapping does not mean eliminating differences. It establishes transparent mappings between local financial structures and the common group-wide logic.
CONSOLIDATION AT LUCANET
If local accounts and financial positions are assigned to a common corporate structure, the financial information for the individual companies can be viewed in a consolidated manner in Lucanet. This provides a comprehensive view of the corporate group without losing sight of the underlying corporate structures.
In this context, consolidation does not simply mean adding up the companies' values. Depending on the existing Lucanet structure and the business requirements, relationships relevant to consolidation are taken into account.
A · Individual Financial Statements
B · Individual Financial Statements
C · Individual Financial Statements
Common Group Structure
Consolidation Logic
Reconciliated Financial Information
Consolidated Income Statement
Consolidated Balance Sheet
Statement of Cash Flows
Schematic representation. The specific consolidation logic depends on the existing Lucanet environment and the business requirements.
The common corporate structure enables comparability. Consolidation brings the financial information together to provide a harmonized view of the group.
ADVANCED FINANCIAL ANALYSIS
The consolidated financial foundation provides a unified view of companies, periods, and key financial metrics. With Power BI, this information can be prepared for in-depth analysis and presented in interactive reports tailored to specific audiences.
Depending on the available data, you can analyze trends over multiple periods, compare companies with one another, and contrast planned, actual, or prior-year figures. Which perspectives are most useful depends on the available Lucanet data and the business requirements.
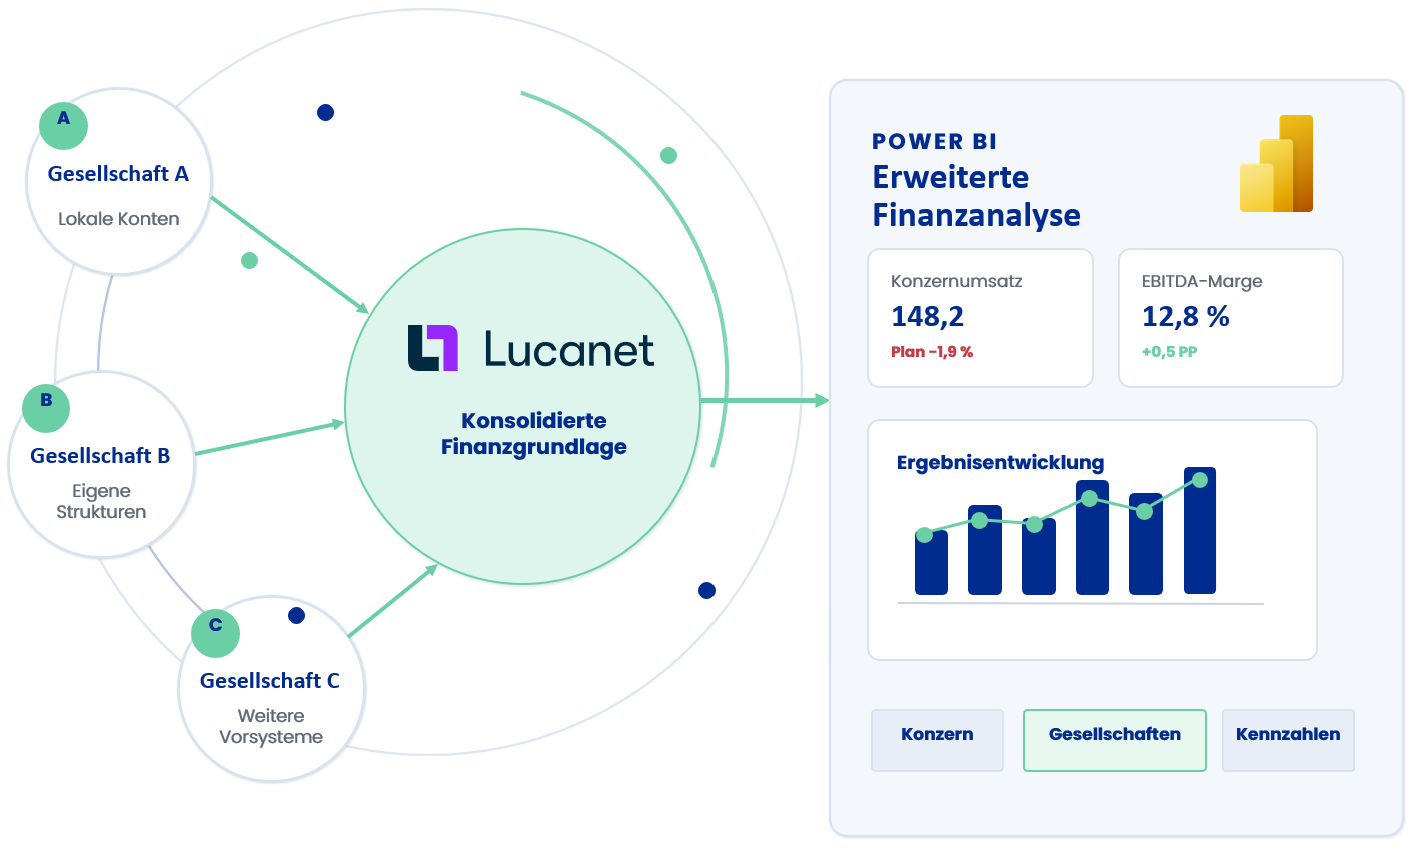
Schematic illustration using arbitrarily chosen demo data.
Power BI does not replace consolidation in Lucanet. It expands the consolidated financial foundation with customized analysis and reporting perspectives.
REPORTING WITH POWER BI
Based on a suitable and technically coordinated data foundation, consolidated Lucanet data can be prepared for various financial and controlling purposes. Which analyses are appropriate depends on the data provided, the existing reporting structures, and the specific requirements.
Items on the income statement can be viewed across reconciled time periods, companies, and consolidated views. This allows for a comprehensive analysis of earnings trends, changes in individual items, and available comparative figures.
Revenue
Total Output
Expense Items
EBITDA or EBIT
Annual Results
Deviations
Trends by Period and Company
Selected balance sheet items can be viewed by period, company, and available reporting structure. This makes changes in the asset and financial structure visible and allows them to be categorized in both consolidated and company-level views.
Fixed Assets
Current Assets
Equity
Liabilities
Total Assets
Structural Ratios
Trends by Period and Company
Once the necessary data and reporting structures are in place, items from the cash flow statement and selected cash flow perspectives can be visualized in Power BI. This provides insight into trends in cash flows and liquidity across periods and companies.
Operating Cash Flow
Investment Activities
Financing Activities
Cash and Cash Equivalents
Liquidity Ratios
Trends Over Time
If appropriate planning and forecast data are available, they can be linked to actual values and other comparative figures. This provides a unified view of expectations, actual developments, and variances.
Target value
Actual value
Forecast
Absolute Deviation
Percentage Deviation
Achievement of Targets
Consolidated financial information can be supplemented with selected company-specific perspectives. Based on common financial accounts and reconciled key metrics, it becomes clear how individual companies are performing and what contribution they make to selected Group figures.
Earnings by Company
Revenue by Company
Expenses by Company
Contribution to Group Value
Company Comparison
Trends Over Time
Items on the income statement can be viewed across reconciled time periods, companies, and consolidated views. This allows for a comprehensive analysis of earnings trends, changes in individual items, and available comparative figures.
Selected balance sheet items can be viewed by period, company, and available reporting structure. This makes changes in the asset and financial structure transparent and allows them to be analyzed in the designated consolidated and company-level views.
Once the necessary data and reporting structures are in place, items from the cash flow statement and selected cash flow perspectives can be visualized in Power BI. This makes it possible to track trends and changes across periods and companies.
If appropriate planning and forecast data are available, they can be linked to actual values and other comparative figures. This provides a unified view of expectations, actual developments, and identifiable variances.
Consolidated financial information can be supplemented with relevant company-level perspectives. Based on common financial accounts and standardized key metrics, it is possible to track how individual units are performing and what share they account for in selected Group figures.
Do not compare or add up company figures and consolidated group figures without careful consideration. Be sure to clearly account for consolidation effects.
Management, Group Controlling, Finance, and FP&A may have different information needs. Selected financial metrics, trends, and variances can therefore be consolidated into coordinated views and tailored to address specific questions.
Common definitions provide consistent perspectives for Group Controlling, Finance, FP&A, and management.
FINANCIAL AND CORPORATE DATA
Consolidated financial information shows how key financial metrics are trending at the Group and company levels. For further analysis, these figures can be linked to selected operational data from other enterprise systems.
This allows financial trends to be analyzed in conjunction with relevant business and performance drivers. The data included depends on the specific question, the existing system landscape, and the information that has been made available.
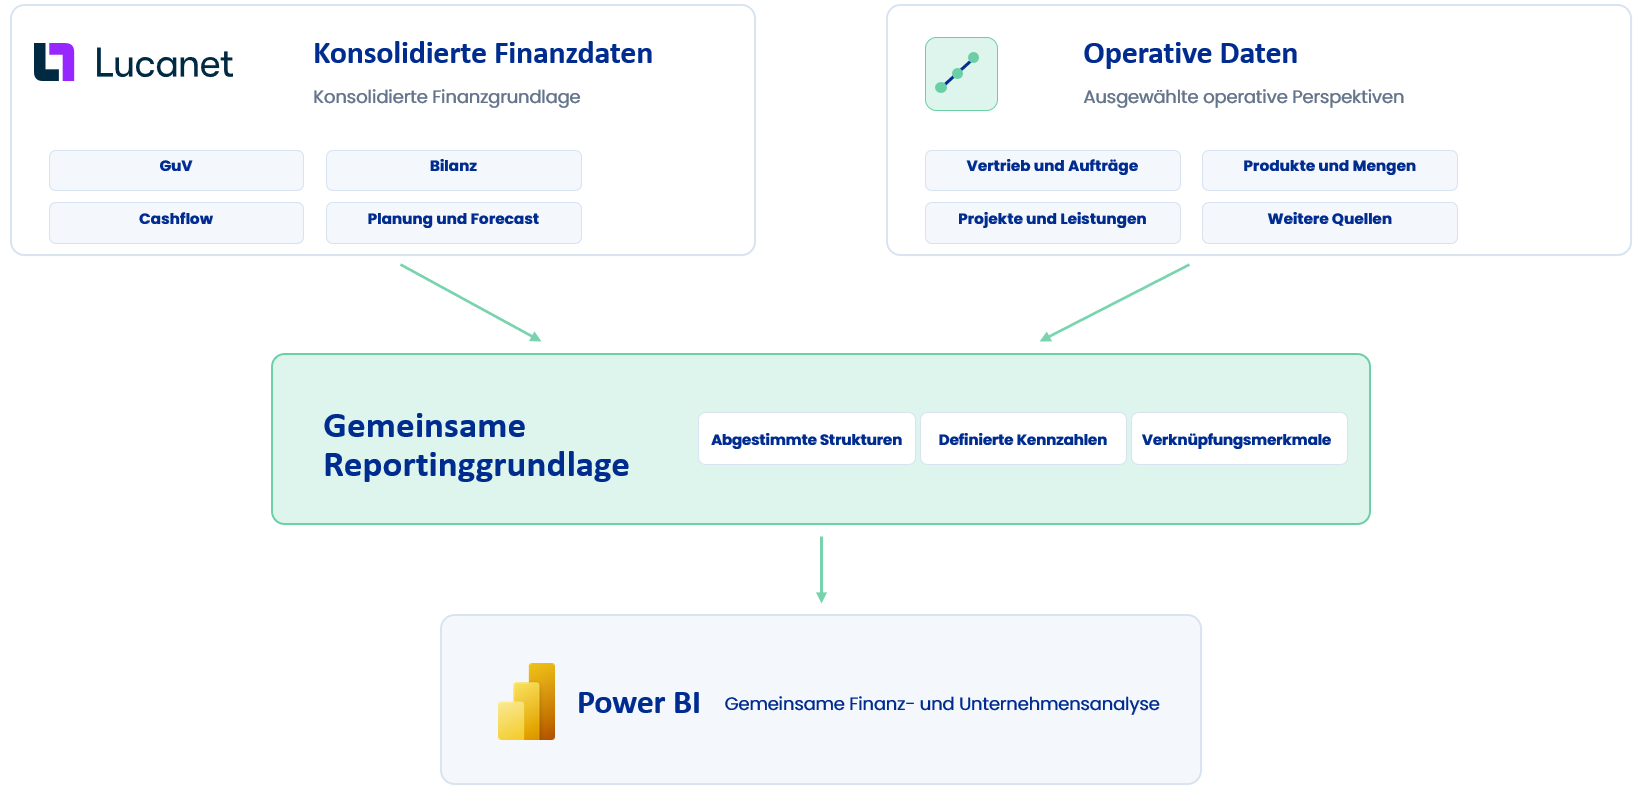
Not every available data source needs to be included. What matters is which information usefully complements a specific financial or controlling question.
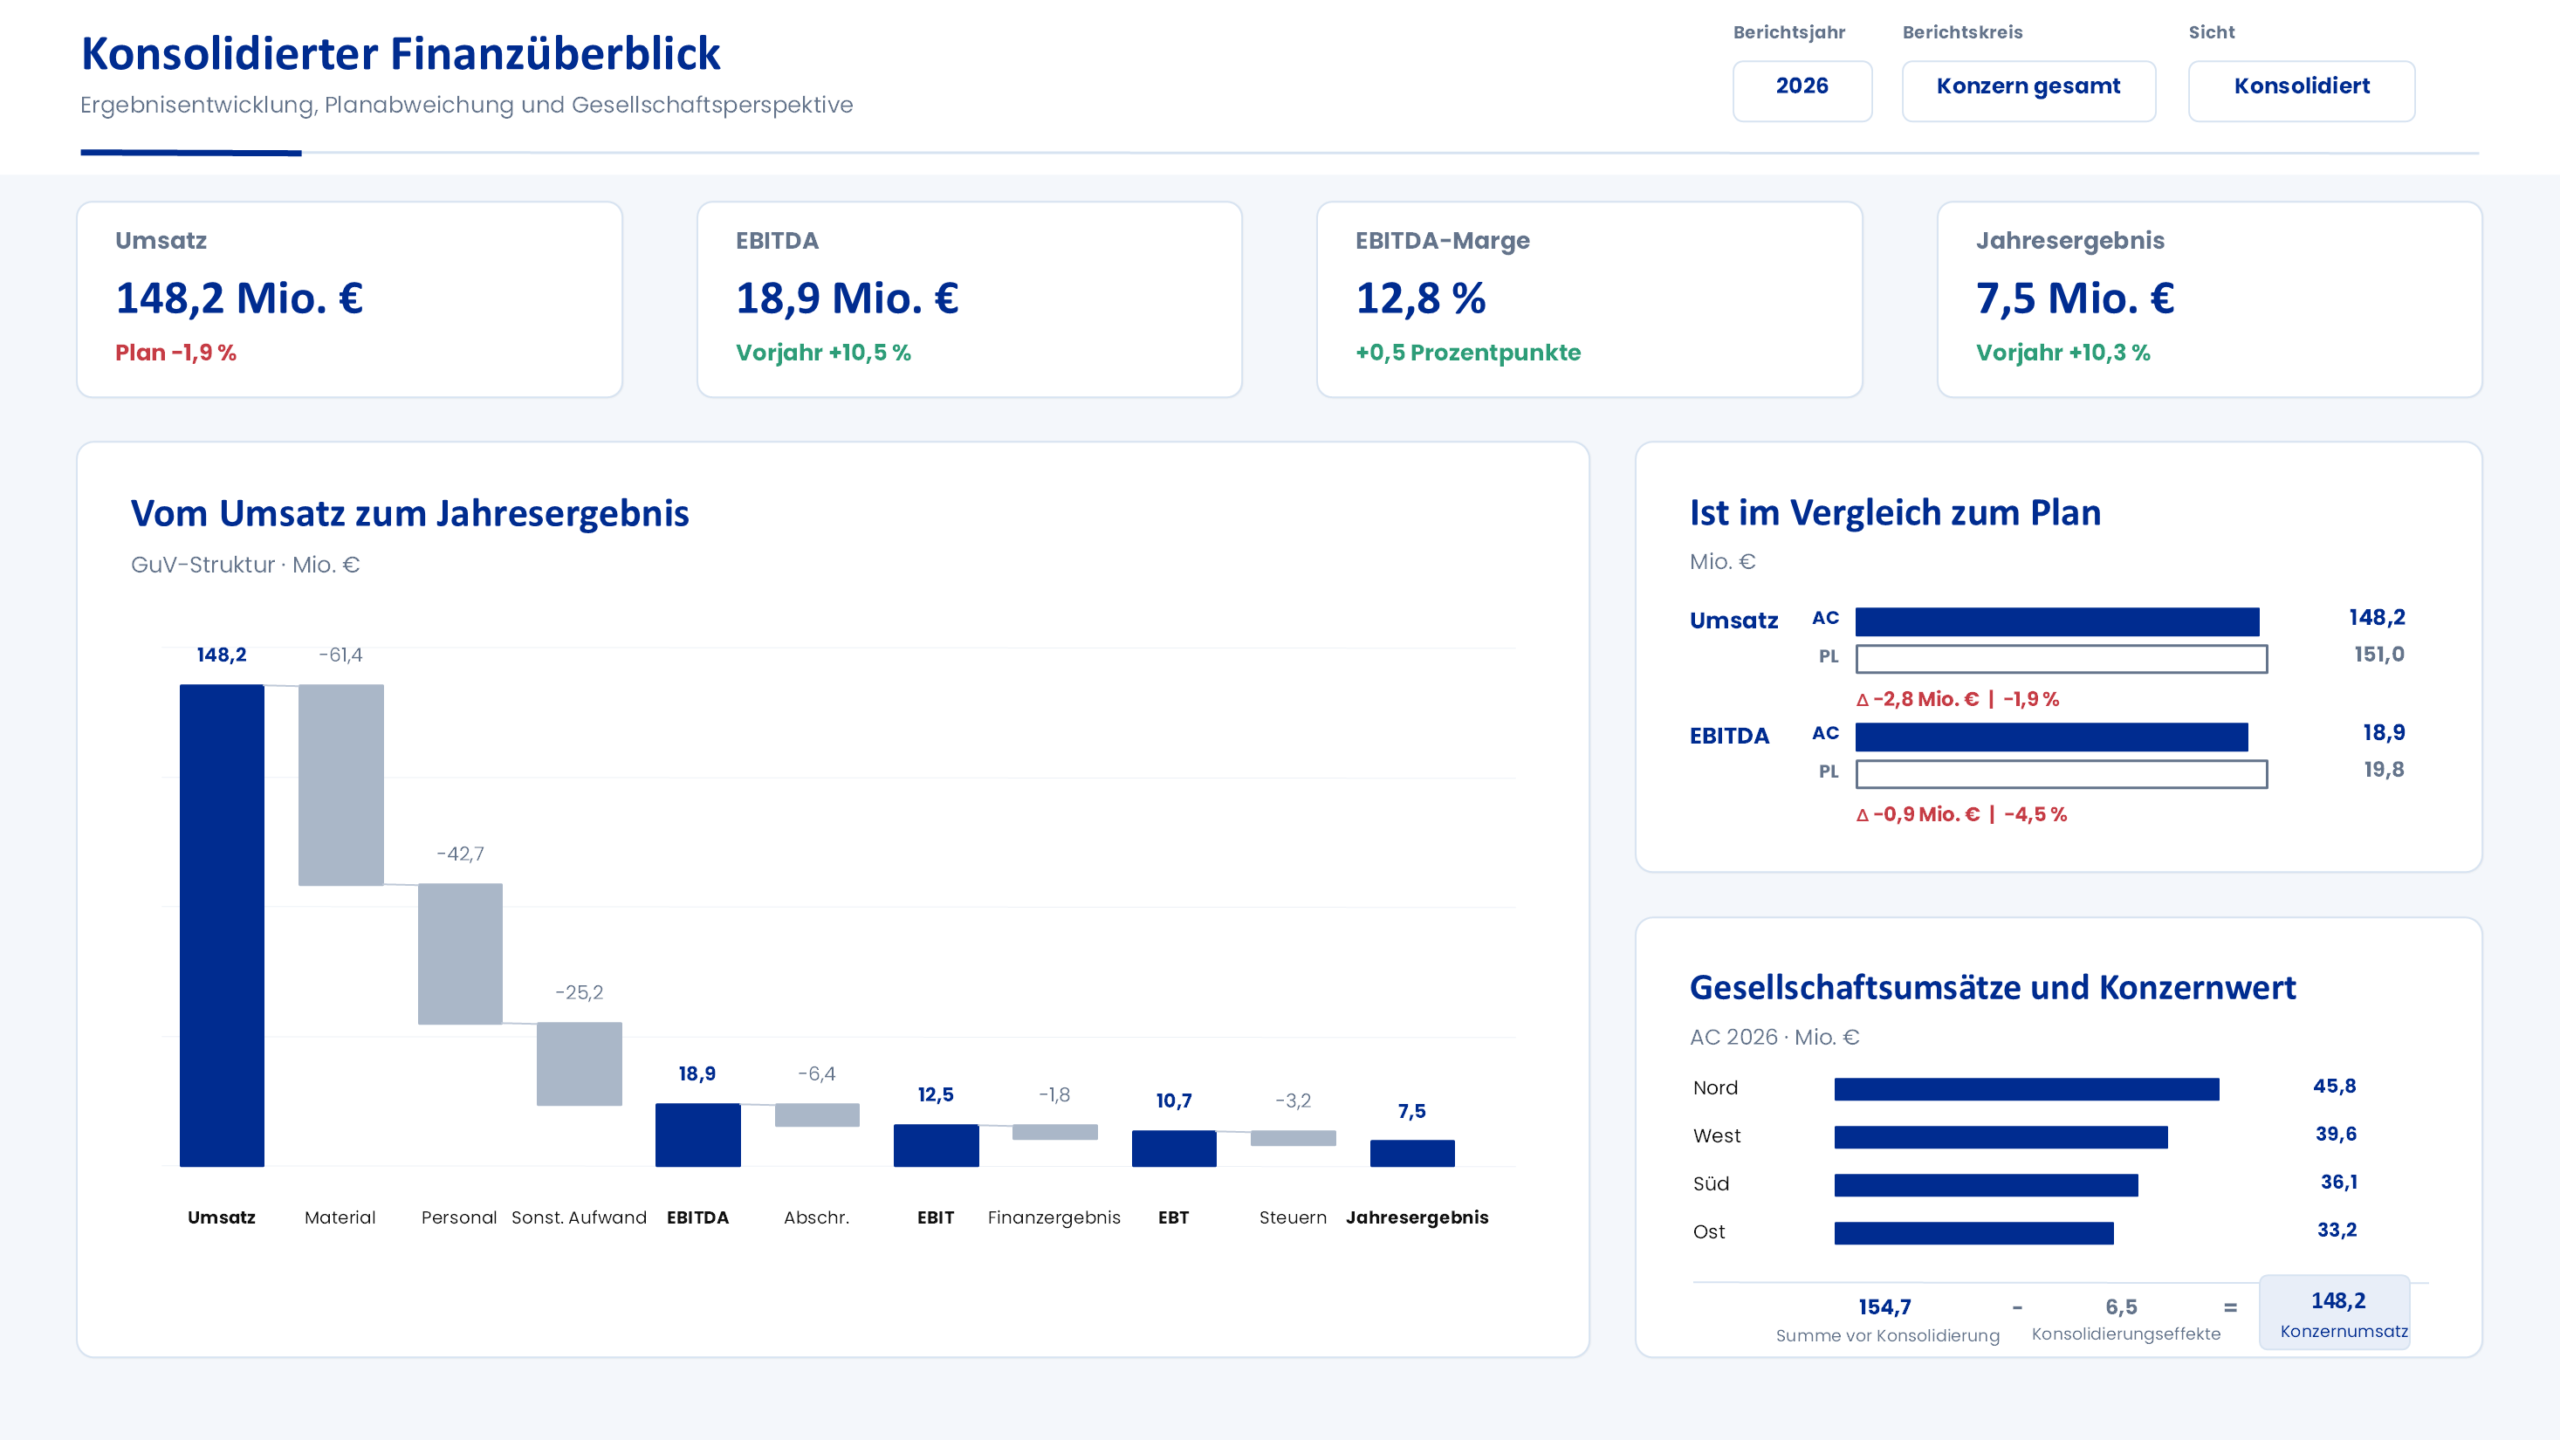
EXAMPLE VIEW WITH SAMPLE DATA
The following sample view combines consolidated financial metrics, trends over time, selected income statement items, and corporate perspectives in a single Power BI report. This allows key group figures and existing benchmarks to be viewed on a consistent basis.
The values shown are sample data chosen at random. The report structure, key metrics, comparison periods, and level of detail are tailored to the available data and business requirements for each project.
JOINT APPROACH
Together, we determine what financial information is needed, how it can be provided, and what analyses should be generated. Building on this, we gradually develop a reporting framework that aligns with the existing data, technical definitions, and intended recipient groups.
To begin with, we’ll review the existing Lucanet environment, current reports, and the relevant financial and corporate structures. Together, we’ll determine which issues are key and which target audiences should be considered.
Next, we review which Lucanet data can be made available for reporting and how financial positions, companies, periods, and comparative figures are structured. The appropriate method of data provision depends on the Lucanet environment, the scope of the data, and the update requirements.
Based on the analysis, we develop a transparent data model for Power BI. Financial positions, key figures, companies, time-based entries, and comparative figures are structured so that they can be used consistently across the intended report views.
Building on this, we develop customized Power BI reports and review key metrics, filters, comparison periods, and report views in collaboration with the relevant business units. Feedback is incorporated into the further development in a transparent manner.
FREQUENTLY ASKED QUESTIONS
Which LucaNet data can be made available to Power BI and how the reporting solution is structured depend on the existing environment, the business requirements, and the planned analyses. Here, we answer key questions about data provision, analysis, and expansion.
Depending on the available data, consolidated information from the income statement, balance sheet, and cash flow statement—as well as corporate structures, periods, financial positions, budget figures, and forecast data—can be prepared for Power BI. The specific Lucanet environment is used to determine which content, key metrics, and levels of detail are available and appropriate for the intended analyses.
The appropriate deployment method depends on the existing Lucanet environment, the required data, and the planned analyses. Depending on the initial situation, for example, a BI database, a data model prepared for analytical purposes, or an existing reporting platform can be used. The required financial positions, companies, time-based entries, and key metrics are then structured in Power BI for analysis.
Not necessarily. Depending on the Lucanet environment, a BI database can be a suitable way to provide financial data for Power BI. Alternatively, you could use, for example, a data model prepared for analytical purposes or an existing reporting platform. The most suitable approach depends on the data required, other data sources, and the technical requirements.
Yes, provided that the necessary corporate, financial, and comparative structures are made available in an appropriate format. Based on common financial accounts and agreed-upon key metrics, consolidated group views as well as selected company-level perspectives can be created in Power BI. This allows for a comparative analysis of trends and contributions from individual companies.
Yes, provided that appropriate and technically comparable planned, actual, and forecast data are made available. In Power BI, for example, this data can be used to generate absolute and percentage variances, trends over time, and comparisons by company or financial position. Prior to implementation, planning statuses, definitions, time frames, and required levels of detail are coordinated with the business.
Yes. If necessary, consolidated financial data can be linked to selected and approved information from other enterprise systems. This may include, for example, order, sales, project, product, or volume data. This requires suitable linking attributes as well as standardized terminology, time references, and organizational structures. This additional information enhances the analysis in Power BI but does not automatically become part of the consolidation process in Lucanet.
No. The consolidation and financial logic remains in Lucanet. Power BI uses the data provided for this purpose to supplement the existing reporting environment with interactive and customized analyses. This may include, for example, group-wide views, company comparisons, trends over time, and combined analyses of financial and business data. Which reports and tools continue to be used depends on their respective purposes.
YOUR LUCANET REPORTING
Whether it's consolidated financial information, different corporate perspectives, or supplementary data from other business systems: Together, we'll determine what information you need for your analyses.