
Reporting for Microsoft Dynamics 365 Business Central with Power BI
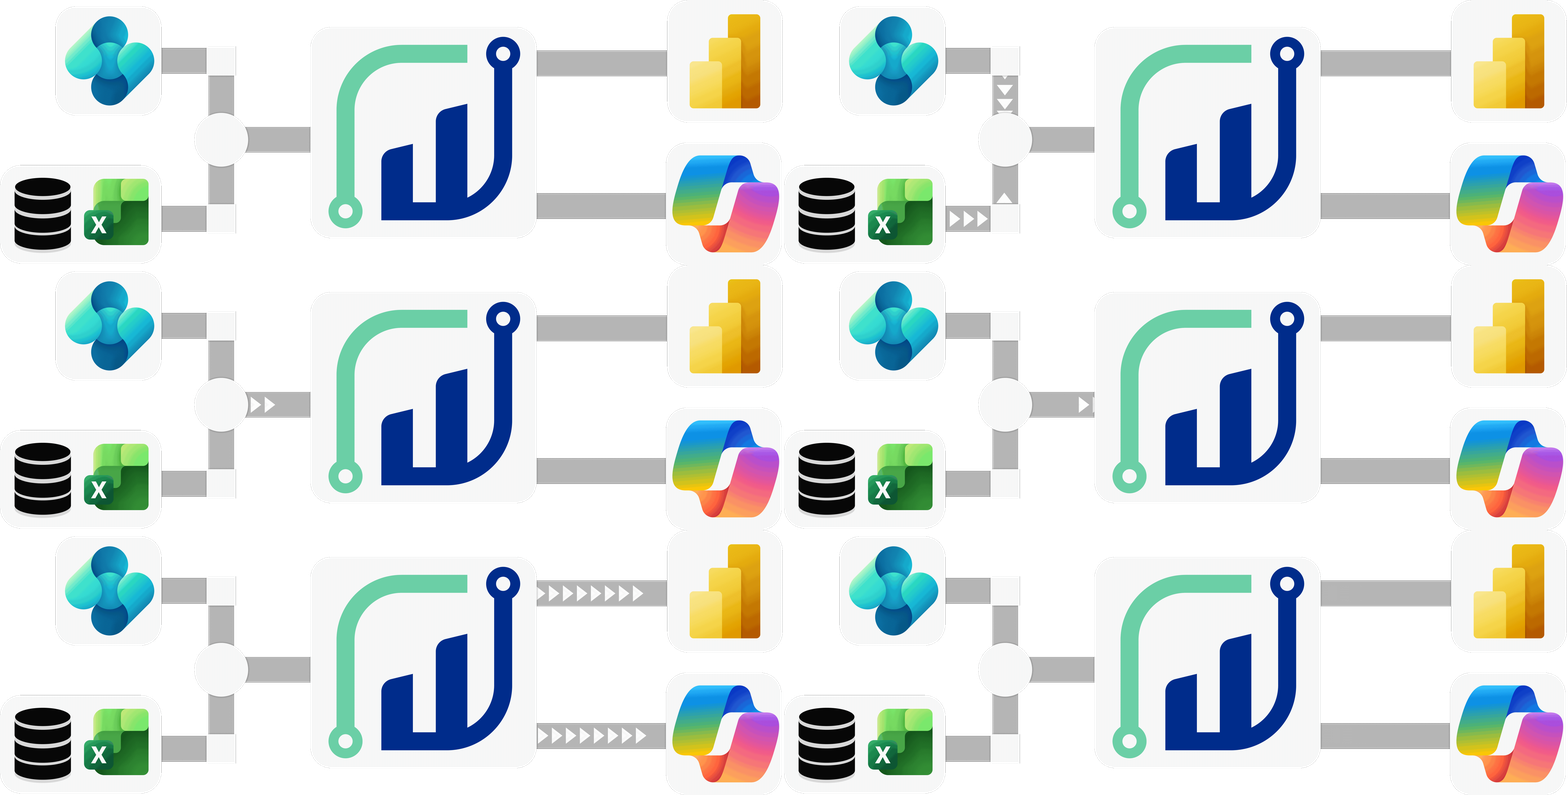
Your information is already on file.
What matters is how you use them.
Shopping
Sales
Finance
Projects
Warehouse
Business Central already contains a great deal of information from day-to-day operations. This information is generated, for example, through journal entries and postings, sales orders, purchase orders, inventory levels, item movements, and projects.
Much of this information is viewed, edited, or utilized directly in Business Central through existing reports. However, when data from multiple areas needs to be analyzed together, trends need to be tracked over longer periods, or specific key metrics need to be provided on a regular basis, a unified view of the data becomes more important.
This is exactly where supplemental reporting with Power BI comes in.
Common Challenges in Reporting with Business Central
Business Central offers various ways to view, analyze, and process information directly within the system. These include, for example, reports, analysis views, dimensions, and working with Excel. However, challenges often arise when data from multiple areas needs to be consolidated, key performance indicators need to be calculated consistently, or analyses need to be provided regularly to different recipients.
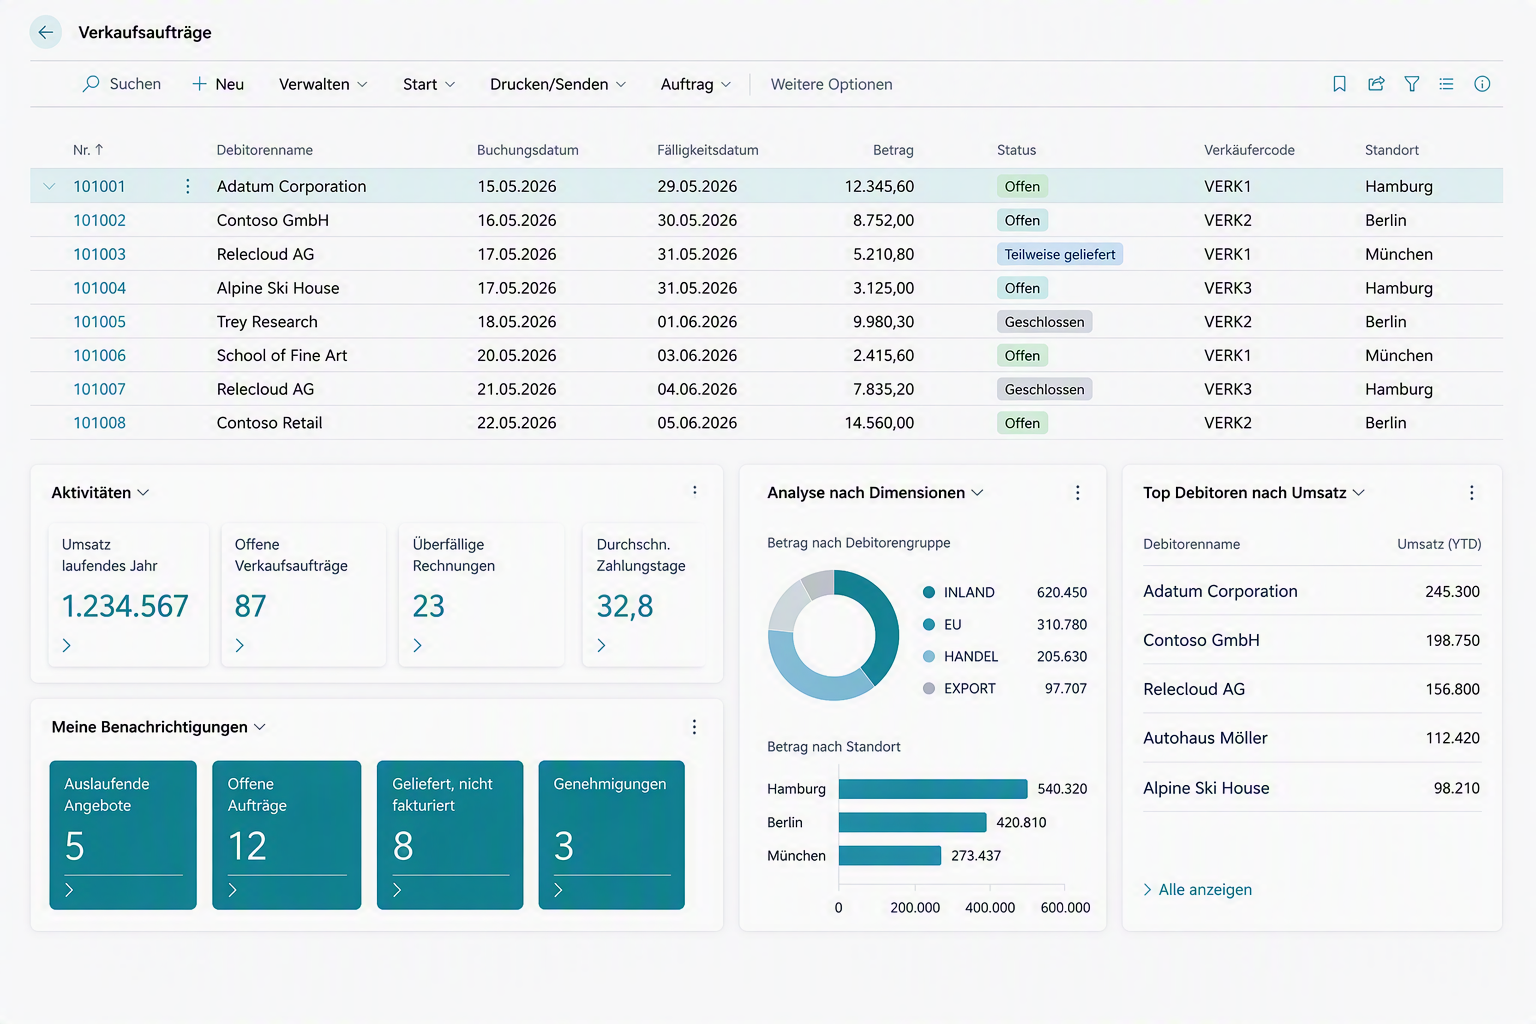
Reports in Business Central
Advanced Analysis with Power BI
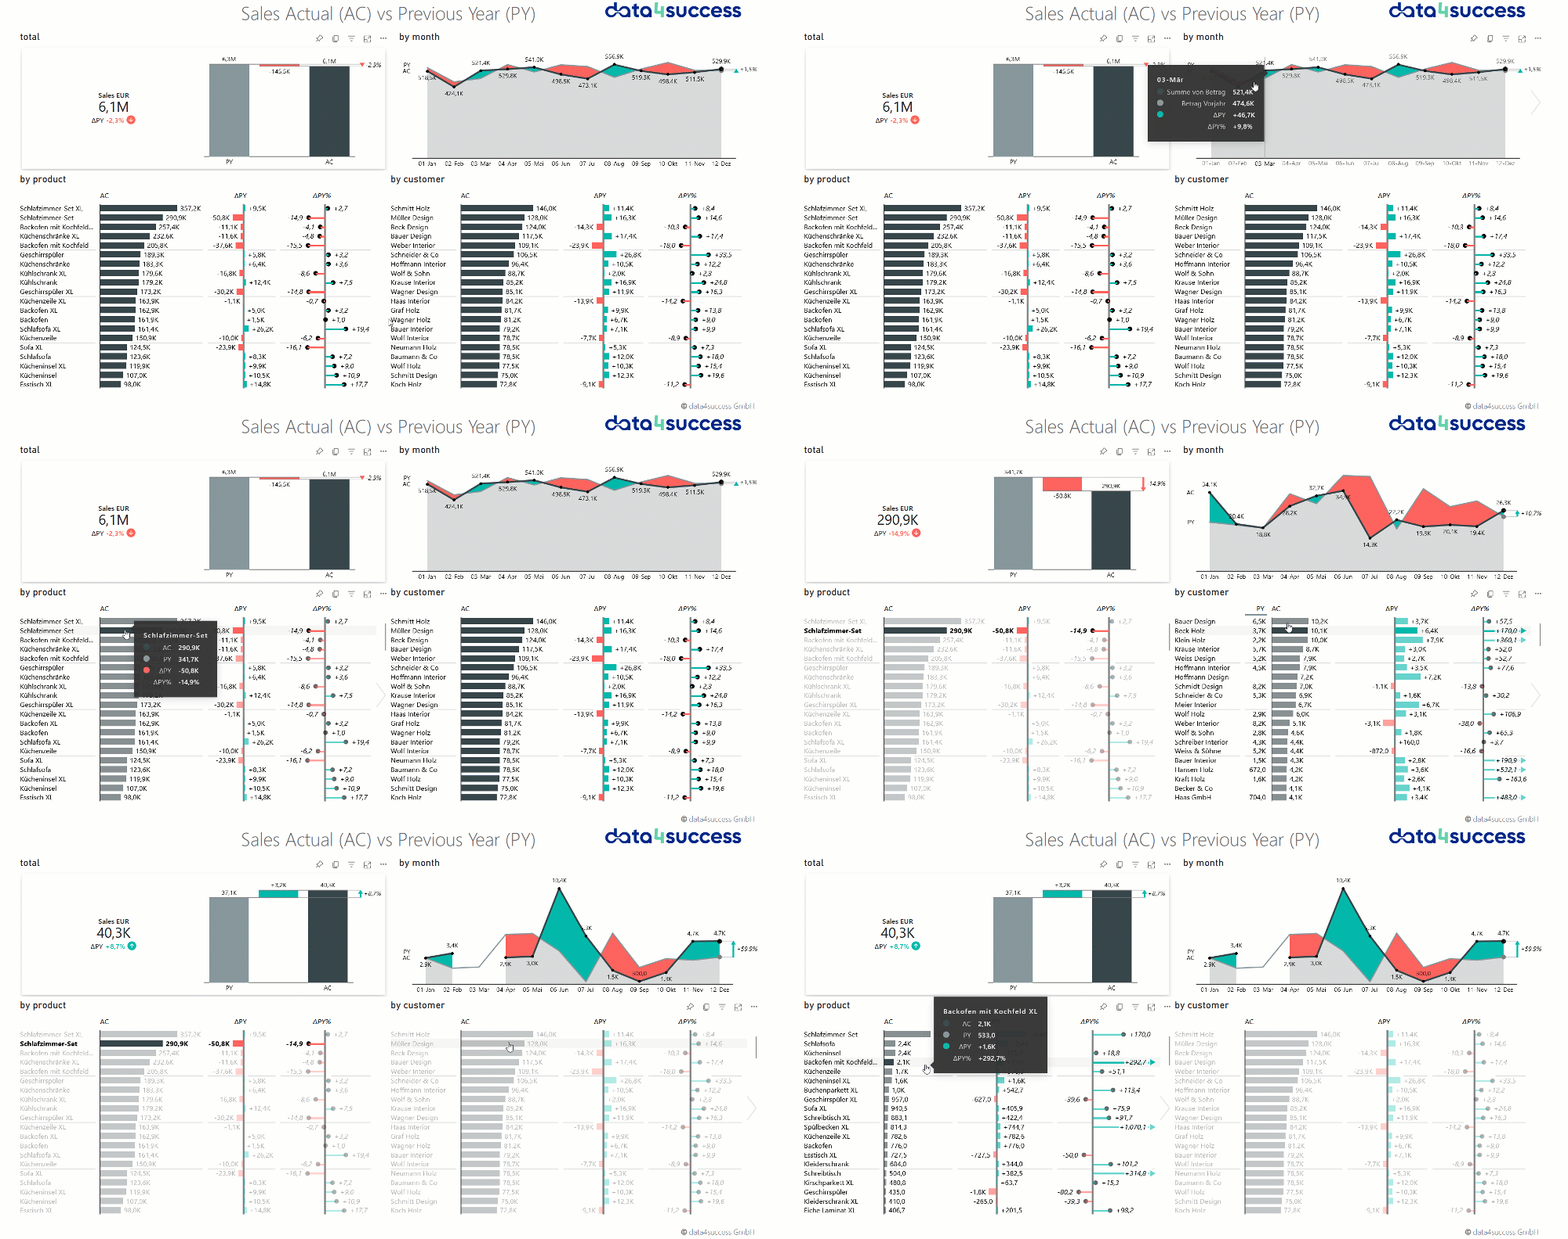
Replace manual Excel analyses
Define Key Metrics Consistently
Key figures such as revenue, open items, inventory value, contribution margin, or project costs can vary depending on the time period, dimension, or calculation logic. Consistent definitions ensure that results remain transparent and are based on the same foundation across different analyses.
Analyze Multiple Clients
If multiple clients, companies, or locations are used in Business Central, the relevant information may be stored in different places. For cross-organizational analyses, this data must be consolidated so that assignments, dimensions, and key metrics can be viewed consistently.
Reduce the effort required for voting
When reports, analytical views, and Excel files are used simultaneously, discrepancies in the numbers can quickly arise. A common reporting framework reduces the effort required for reconciliation and makes it easier to provide recurring analyses to various recipients.
Flexibly Analyze Data from Business Central Using Power BI
Business Central contains a wealth of information from business and operational processes. For reporting with Power BI, this data can be organized in a structured format and consolidated into a single data model.
The data and analyses that can be included depend on the specific Business Central environment, the features used, the dimensions, and the available data sources. Among other things, the following areas can be included:
Analyze Financial Data in a Structured Manner
Analyze journal entries, account balances, open items, and cash flows across different time periods, dimensions, or companies. This allows you to present financial trends and variances in a clear and transparent manner.
- Statement of Income and Expenses and Balance Sheet
- Account Balances by Time Period or Dimension
- Analysis of Open Accounts Receivable and Accounts Payable Items
- Cash Flow and Liquidity Trends
- Comparison of Actual Values, Budgets, and Planned Values
Analyze Sales Data Transparently
Analyze sales orders, invoices, accounts receivable, and items across different time periods, dimensions, or salespeople. This makes it easier to quickly identify sales trends, open orders, and discrepancies in the sales process.
- Trends in Revenue and New Orders
- Overview of Open Sales Orders
- Revenue by customer, item, project, or department
- Sales by Seller Code or Location
- Comparison of Prices, Discounts, and Contribution Margins
Keeping Track of Purchasing and Procurement
Examine purchase orders, vendors, items, and order quantities across different time periods, dimensions, or product groups. This makes it easier to track purchasing volumes, price trends, and outstanding orders in the procurement process.
- Trends in Purchasing Volume and Orders
- Overview of Open Purchase Orders
- Purchasing Volume by Vendor, Item, or Product Category
- Analysis of Prices, Discounts, and Terms
- Comparison of Suppliers, Delivery Times, and Order Quantities
Analyze Inventory and Availability in a Targeted Manner
Analyze inventory levels, item movements, inventory values, and availability by time period, warehouse location, or item group. This reveals how inventory levels are changing, where capital is tied up, and where potential bottlenecks may arise.
- Changes in Inventory Levels and Item Movements
- Inventory by item, location, or item group
- Analysis of Inventory Values and Capital Tie-Up
- Overview of Availability and Potential Shortages
- Analysis of Coverage, Turnover, and Changes in Inventory
Keeping Track of Project Costs and Progress
Analyze project budgets, actual costs, project billing, and expenses by project, task, time period, or dimension. This provides you with a clear foundation for better assessing budget variances, financial trends, and open project items.
- Comparison of Budget, Actual Costs, and Project Settlement
- Project Costs by Task, Resource, Department, or Cost Center
- Analysis of Project Progress and Outstanding Work
- Analysis of Project Accounting and Contribution Margins
- Overview of Variances Between Planned and Actual Values
Finance
Analyze Financial Data in a Structured Manner
- Statement of Income and Expenses and Balance Sheet
- Account Balances by Time Period or Dimension
- Analysis of Open Accounts Receivable and Accounts Payable Items
- Cash Flow and Liquidity Trends
- Comparison of Actual Values, Budgets, and Planned Values
Sales
Analyze Sales Data Transparently
- Trends in Revenue and New Orders
- Overview of Open Sales Orders
- Revenue by customer, item, project, or department
- Sales by Seller Code or Location
- Comparison of Prices, Discounts, and Contribution Margins
Shopping
Keeping Track of Purchasing and Procurement
- Trends in Purchasing Volume and Orders
- Overview of Open Purchase Orders
- Purchasing Volume by Vendor, Item, or Product Category
- Analysis of Prices, Discounts, and Terms
- Comparison of Suppliers, Delivery Times, and Order Quantities
Warehouse
Analyze Inventory and Availability in a Targeted Manner
- Changes in Inventory Levels and Item Movements
- Inventory by item, location, or item group
- Analysis of Inventory Values and Capital Tie-Up
- Overview of Availability and Potential Shortages
- Analysis of Coverage, Turnover, and Changes in Inventory
Projects
Keeping Track of Project Costs and Progress
- Comparison of Budget, Actual Costs, and Project Settlement
- Project Costs by Task, Resource, Department, or Cost Center
- Analysis of Project Progress and Outstanding Work
- Analysis of Project Accounting and Contribution Margins
- Overview of Variances Between Planned and Actual Values
More than just a single report
Business Central and Other Sources
ERP data, planned values, CRM data, Excel files, or other operational applications
Shared Database
Structured relationships and uniformly defined key performance indicators
Power BI Reports
Interactive analyses for different departments and perspectives
A database that fits your Business Central environment
Provide Business Central Data in a Structured Format
Incorporate additional data sources in a targeted manner
Lay the groundwork for further analysis
Use Power BI Directly in Business Central
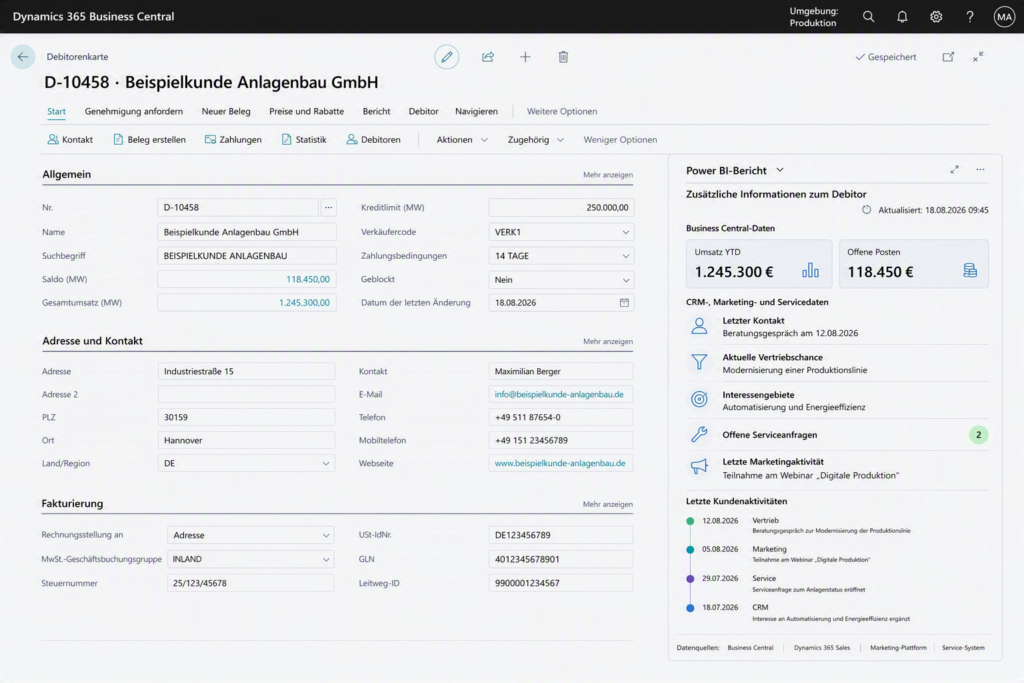
Custom-developed Power BI reports can be integrated directly into Business Central. On list or map pages, the displayed analysis can be based on the currently selected data record. This provides users with additional information directly within their familiar Business Central work environment.
Information from other applications—even those not stored in Business Central—can also be included. For example, you can view supplementary CRM, marketing, or service data in the context of a customer, contact, or transaction.
Example of a custom Power BI report created directly in Business Central.
A Foundation for Reporting and AI
A structured and technically harmonized database forms the foundation for reliable reporting. Building on this, we develop a semantic model in which data from different sources is linked, key metrics are defined consistently, and subject-matter terms are unambiguously assigned. This ensures that different Power BI reports draw on the same subject-matter relationships and calculation logic.
Upon request, we can further develop this foundation for forecasts, AI applications, or copilot scenarios. To do so, we identify suitable use cases, prepare the necessary data, and implement the models, algorithms, and agent solutions based on it. Instead of accessing unverified raw data directly, these applications can draw on information that has been professionally processed and curated.
Power BI semantic models can, for example, serve as a data source for AI-powered data agents. By structuring the data and clearly defining metrics, terms, and relationships, we lay the foundation for consistent and meaningful answers.
Shared Database
Structured data from Business Central and other sources
Semantic Model
Consistently defined metrics, terms, and technical relationships
Power BI Reports
Interactive analyses based on a common technical foundation
Forecasts
Data-Driven Assessments of Future Developments
AI and Copilot
Consistent answers based on your processed business data
Microsoft Fabric as a Possible Next Step
Microsoft Fabric can be a useful next step if Business Central-based reporting is intended not only to generate individual reports but also to support multiple departments, data sources, and analyses over the long term.
If Business Central is run in the cloud, we use Fabric for automated deployment and regular synchronization of the required data. In an on-premises environment, we assess whether a leaner database without Microsoft Fabric is sufficient. The key factors are the planned scope and the requirements for deployment, updating, and scalability.
When Fabric Can Be Useful
- Using Multiple Data Sources Together
- Centralize data processing and distribution
- Creating a Common Basis for Multiple Reports
Here's how we approach your Business Central reporting
Every reporting solution starts with specific questions, existing analyses, and the relevant Business Central environment. Together, we’ll determine what information is needed and how we can use it to create a suitable reporting structure with Power BI.
Understanding the Initial Situation
Review Data and Key Metrics
Develop a database and data model
Implementing Power BI Reports
Integrating Reporting into Day-to-Day Work
Experience with Business Central data and reporting
data4success specializes in business intelligence, data models, and reporting solutions for medium-sized companies. We focus not only on the visible reports, but also on the data structures, business relationships, and calculation logic that form the foundation of reliable reporting.
Business Central is one of our core areas of expertise. Our team has many years of experience with Business Central data, Microsoft SQL Server, data migrations, data models, and Power BI. This enables us to take into account both the technical data infrastructure and the business requirements of future users.
Understanding ERP Data
We analyze existing data structures and identify the information needed for the desired analyses.
Building Data Models
We organize data in a structured manner and present technical relationships and calculation logic in a way that is easy to understand.
Implement Reporting
We develop Power BI reports that meet the information needs of the intended users and departments.
Frequently Asked Questions About Reporting with Business Central
Here you'll find answers to frequently asked questions about analyzing Business Central data with Power BI and designing a suitable reporting solution.
Can data from Business Central be analyzed using Power BI?
Yes. In our experience, all data available in Business Central can be prepared for use in Power BI. The specific content that is available depends on the modules in use and the data recorded within them.
What Business Central data can be included in reporting?
Data from finance, sales, purchasing, inventory, and projects can be included, as well as other information available in Business Central. We determine which data is relevant for reporting based on the desired analyses and key metrics.
Are the existing reports and analysis views in Business Central not sufficient?
The reports, analytical views, and Excel capabilities available in Business Central can be helpful for addressing specific operational questions. However, when cross-functional analyses, standardized metrics, or regular reports for various recipients are needed, a complementary Power BI solution may be beneficial.
Is the standard Business Central connector for Power BI sufficient?
The standard connector allows for a quick start and provides data on typical Business Central entities. However, additional data is often required for company-specific metrics, additional tables, and an extensible data model. We obtain this data in a targeted manner and consolidate it into a unified reporting framework.
Can Excel files or planned values also be taken into account?
Yes. In addition to Business Central data, Excel files, budget figures, or other supplementary information can also be included as needed. It is important that this data be consolidated in a way that makes business sense and made available for joint analysis.
Is Microsoft Fabric required for Business Central reporting?
Not necessarily. A smaller database may be sufficient for a manageable start. Microsoft Fabric can be useful if you need to integrate multiple data sources, generate many reports, or build a centralized and scalable data platform.
Can multiple clients, companies, or locations be analyzed together?
Yes, provided that the necessary data is available and can be consolidated in a technically sound manner. In doing so, classifications, dimensions, and key metrics must be aligned in such a way that the results remain comprehensible across the board.
Can existing reports still be used?
Existing reports, analytical views, or Excel analyses can serve as a starting point. Not every existing analysis needs to be replaced immediately. Together, we’ll determine which content should be carried over, adapted, or gradually migrated to Power BI.
Are custom metrics and reports possible?
Yes. Reports and key metrics can be tailored to your company's specific business needs. We will work with you to determine which calculation logic, time periods, filters, and levels of analysis are required.
For which business units is reporting based on Business Central suitable?
Power BI reporting based on Business Central is suitable for finance, sales, purchasing, inventory, and projects, among other areas. The key is not to display as much data as possible, but to consolidate the information needed for specific analyses, key metrics, and decisions. Depending on the Business Central environment, other areas or additional data sources can also be included.
Preconfigured Standard Reports for Business Central
Sales Reporting
Analyze sales, accounts receivable, products, and trends in an interactive Power BI report.
Financial Reporting
Gain insight into your income statement, balance sheet, and financial metrics in a single, consolidated report.
Starter Pack
The standard reports are each available as a starter package for 3,000 euros plus license fees. Once the necessary access credentials have been provided, implementation typically takes place within two weeks.
Business Central Cloud or On-Premises
If Business Central is run in the cloud, the Fabric Starter package is part of our reporting solution. It handles the automated provisioning and regular synchronization of the required data. In an on-premises environment, we assess whether a leaner database without Microsoft Fabric is sufficient.
Fabric Starter Kit
The Fabric Starter Package is available for 2,000 euros. It includes the initial setup of the Fabric structure, integration with Business Central data, configuration of automated data loading processes, and a personalized introduction.
Fabric Capacity
Our provisioning processes are intentionally designed to be lightweight, so that only the fabric capacity that is actually needed is used. For many entry-level scenarios, even a small F2 capacity may therefore be sufficient. Licensing costs start at around 170 euros per month, depending on the region, billing model, and Microsoft contract. We determine the exact price based on the current Microsoft offer.
Licensing and Cost Information
License fees for Power BI, Zebra BI, and, if applicable, Microsoft Fabric are not included.
If you have multiple Business Central tenants, separate system environments, or specialized data structures, the effort required to provision and consolidate the data may vary. In such cases, we will assess the initial situation in advance and tailor the scope of the project to your specific needs.
Would you like to get more out of your Business Central data?
If generating reports currently involves a lot of manual work, if it’s difficult to consolidate important information, or if there are conflicting figures circulating, it’s worth taking a closer look at your reporting structure.
We'd be happy to discuss with you what data you already have and how we can use it to develop a suitable Power BI solution.