
Reporting for AUDITOR plus
with Power BI
for transparent and flexible analyses.
Your information is already on file.
What matters is how you use them.
Training Sessions
Supporting Documents
Organization
Measures
Work Materials
Hazards
AUDITOR plus tracks a wide range of information related to occupational safety and health. This includes, for example, data on individuals, organizational units and work areas, qualifications, training sessions, hazard assessments, work materials, measures, and deadlines.
Much of this information is already managed directly in AUDITOR and used in day-to-day work. Additional requirements arise, in particular, when data from different subject areas needs to be analyzed together, trends need to be tracked over longer periods, or customized reports need to be provided for different recipients.
This is exactly where supplemental reporting with Power BI comes in.
Use AUDITOR data for further analysis
Depending on the task at hand, different types of information, time periods, and data sources may be relevant for an analysis. A common reporting framework helps to present these relationships in a clear and understandable way.
Combining Data from Multiple Areas
Include additional data sources
Supplementary information from time tracking, workforce planning, vacation planning, or other applications can be linked to AUDITOR data. This makes it possible to answer questions for which data from a single system is insufficient.
Track Progress and Deadlines
Measures, qualifications, training sessions, dates, or other relevant information can be analyzed over various time periods. This makes it easier to identify changes, outstanding issues, and potential areas requiring action.
Provide targeted reports
Information can be tailored to suit different tasks, areas of responsibility, or recipients. This provides subject matter experts and managers with a view of the data that is relevant to their specific needs.
What's Possible with Connected Data
The possible analyses depend on the available data and the specific requirements. The following scenarios illustrate how data from AUDITOR can be combined with information from other applications and processed to address specific business questions.
EXAMPLE 1
Find suitable and available people for an assignment
For specific tasks, it is often not enough to simply know which individuals have the necessary qualifications and training. It is just as important to know whether they are actually available during the specified time period.
Information from AUDITOR can be linked to data from HR or leave planning for this purpose. The analysis shows, for example, which individuals fully or partially meet the specified requirements and are available at the selected time.
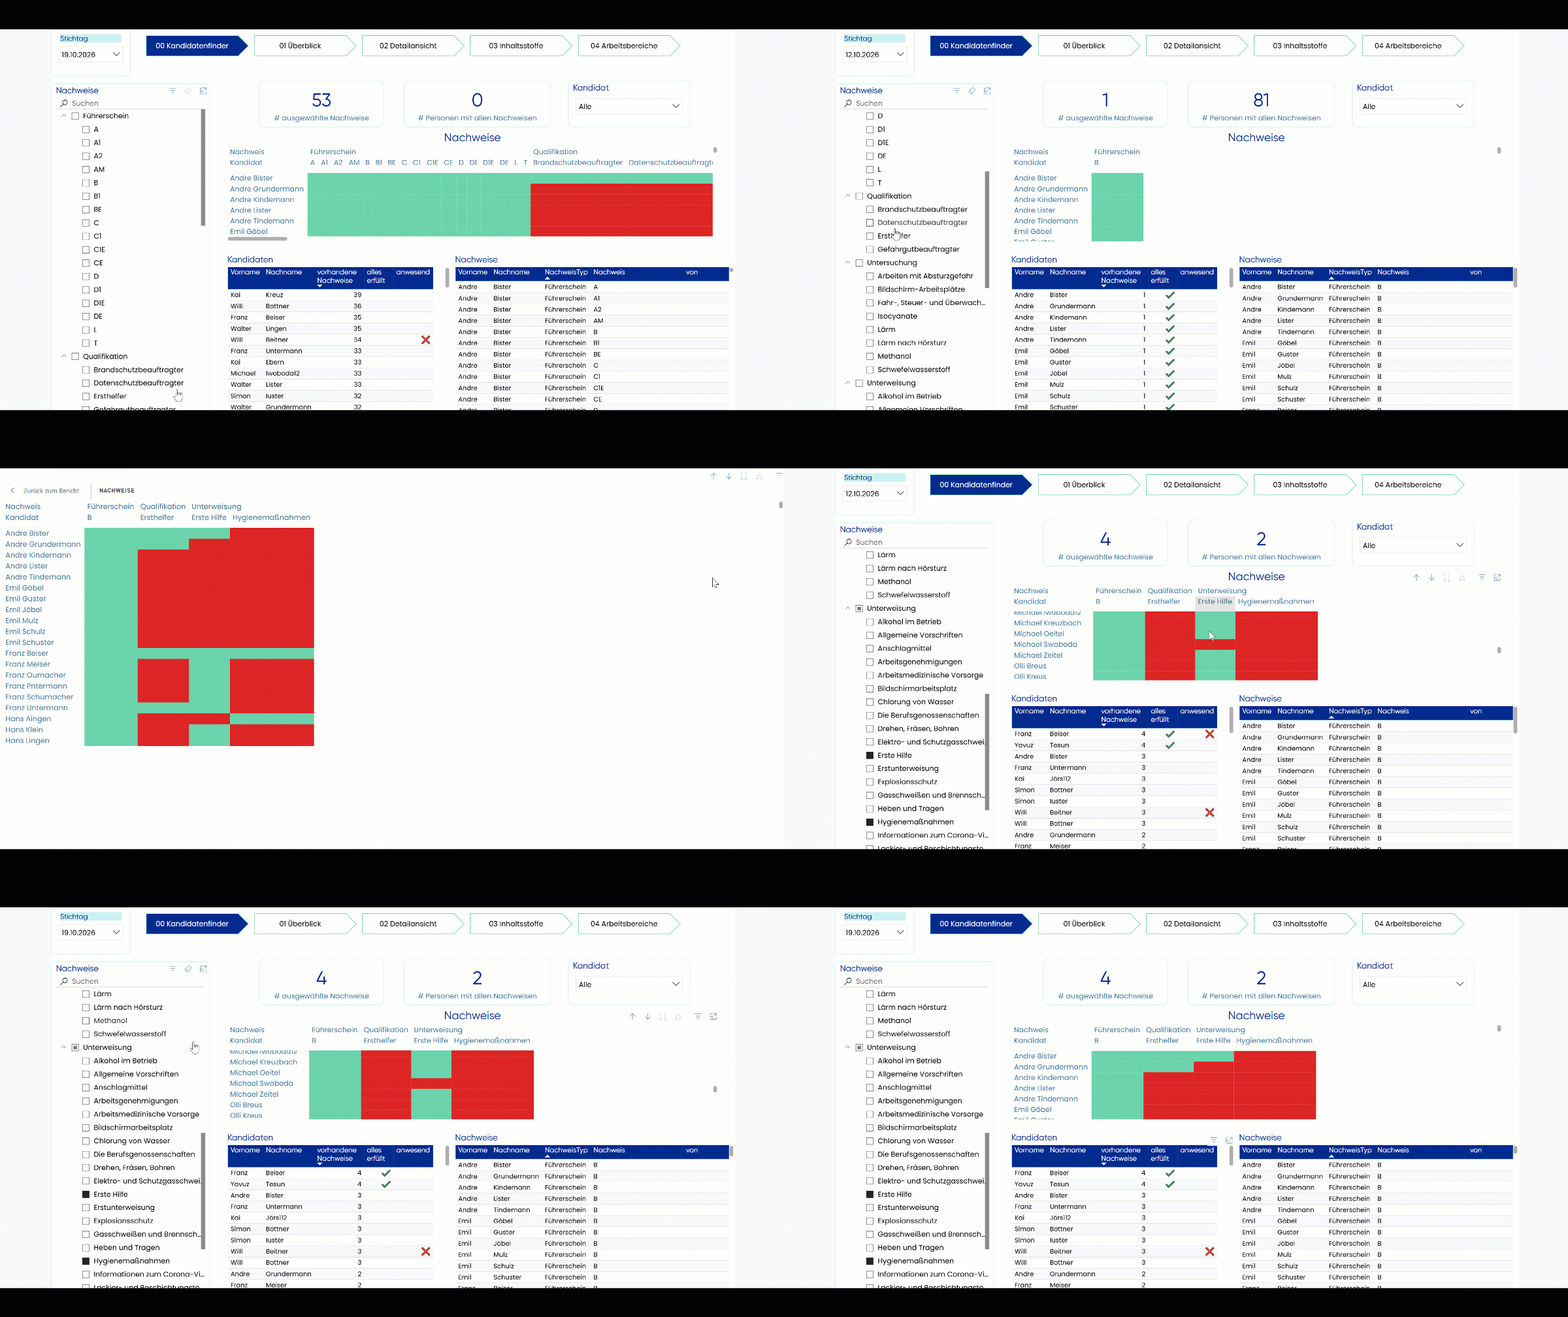
Define Requirements
Determine the qualifications and training required for the specific task.
Compare Requirements
Identify which individuals fully or partially meet the requirements.
Consider availability
Include information from personnel or vacation planning for the selected time period.
EXAMPLE 2
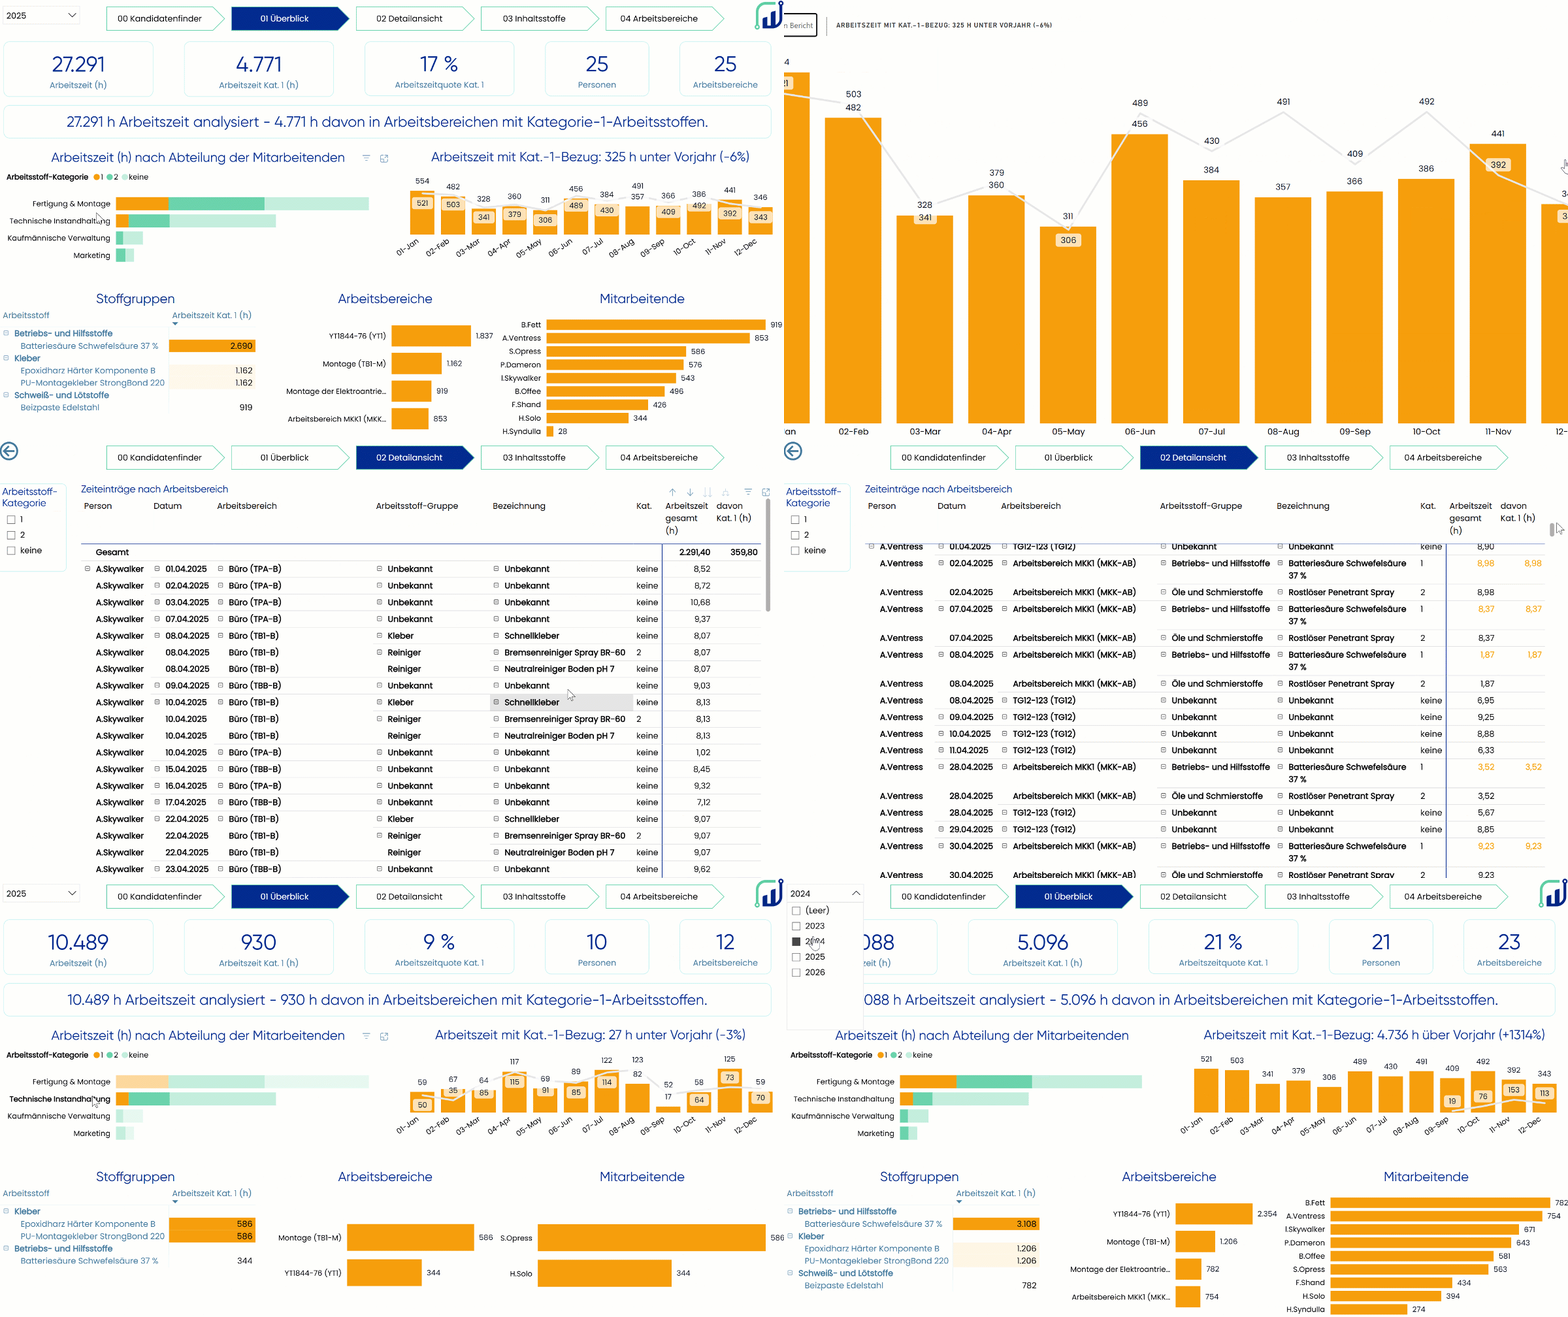
Highlighting Exposures and Connections
Accurately record the level and duration of exposure
List of Exposures in Accordance with the Hazardous Substances Ordinance and TRGS 410
With Power BI, AUDITOR data can be linked to information from time tracking and analyzed from various perspectives. This allows the temporal component to be depicted in a transparent manner. It provides an important foundation for classifying exposures in a technical context and preparing the necessary documentation.
Connecting Information
Link AUDITOR data on individuals, work areas, and substances to data from time tracking.
Track the duration of exposure
Determine when and for how long people were working in relevant work areas.
Support Documentation
Provide analysis results in a structured format and make them available for further documentation.
Take long-term documentation into account
In the event of hazardous exposure to carcinogenic or germ cell mutagenic hazardous substances in Categories 1A or 1B, the exposure record must include information on the level and duration of exposure and must be retained for 40 years after the end of exposure.
Try out the live report for yourself
Explore examples of how to filter exposure data in Power BI and view it from different perspectives.
Flexibly Analyze AUDITOR Data with Power BI
The information included in an analysis depends on the AUDITOR modules used and the specific business questions being addressed. We organize the relevant data in a structured manner and use it to develop Power BI reports that align with existing processes and requirements.
The subject areas can be considered individually or combined to address more complex questions. The following examples illustrate the types of analyses that are possible.
Overview of People and Organizational Structures
Consider individuals, organizational units, and work and operational areas from different perspectives. This makes it possible to understand relationships and changes across the board.
- People by Organizational Unit, Department, or Location
- Assignment of Individuals to Areas of Work and Responsibility
- Enrollments and Withdrawals Over Time
- Distribution of Individuals Across Different Organizational Units
- Changes in Organizational Structures
Evaluate Qualifications and Training in a Targeted Manner
Analyze existing and required qualifications, training, medical examinations, or other documentation. This will help you identify which requirements have been met and where action is needed.
- Overview of Valid and Expiring Qualifications
- Compare required and completed training sessions
- Target-Actual Comparisons for Individuals or Work Areas
- Identifying Missing or Incomplete Documentation
- Evaluate requirements by organizational unit or job function
Consider Hazards by Work Area
Compile information on hazards, activities, individuals, and work and organizational areas. This allows for a nuanced analysis of the affected areas and relevant interrelationships.
- Hazards by Work or Organizational Area
- Affected individuals and groups
- Assigning Tasks to Relevant Work Areas
- Frequency and Distribution of Specific Hazards
- Developments and Changes Over Time
Evaluate substances and related exposures
Link information on agents, ingredients, work areas, measurement values, and affected individuals. This allows exposures to be analyzed from different technical and temporal perspectives.
- Work Materials by Work or Organizational Area
- Classification of Substances and Ingredients
- Affected individuals and groups
- Measurements and Exposures Over Time
- Notable developments or relevant areas
Track actions and deadlines in a transparent manner
Work together to review actions, responsibilities, deadlines, and status updates. This will help you see which tasks are pending, completed, or relevant within a specific time frame.
- Overview of Open and Completed Measures
- Measures by Work or Organizational Area
- Upcoming and Past Deadlines
- Responsibilities and Processing Status
- Trends in Open Measures Over Time
Organization
Overview of People and Organizational Structures
- People by Organizational Unit, Department, or Location
- Assignment of Individuals to Areas of Work and Responsibility
- Enrollments and Withdrawals Over Time
- Distribution of Individuals Across Different Organizational Units
- Changes in Organizational Structures
Qualifications and Training
Evaluate Qualifications and Training in a Targeted Manner
- Overview of Valid and Expiring Qualifications
- Compare required and completed training sessions
- Target-Actual Comparisons for Individuals or Work Areas
- Identifying Missing or Incomplete Documentation
- Evaluate requirements by organizational unit or job function
Hazards
Consider Hazards by Work Area
- Hazards by Work or Organizational Area
- Affected individuals and groups
- Assigning Tasks to Relevant Work Areas
- Frequency and Distribution of Specific Hazards
- Developments and Changes Over Time
Work Materials
Evaluate substances and related exposures
- Work Materials by Work or Organizational Area
- Classification of Substances and Ingredients
- Affected individuals and groups
- Measurements and Exposures Over Time
- Notable developments or relevant areas
Measures
Track actions and deadlines in a transparent manner
- Overview of Open and Completed Measures
- Measures by Work or Organizational Area
- Upcoming and Past Deadlines
- Responsibilities and Processing Status
- Trends in Open Measures Over Time
More than just a single report
A good reporting solution consists of more than just clear charts. Equally important is a technically sound foundation in which data, relationships, and key metrics are presented in a transparent manner. This ensures that different analyses are consistently based on the same definitions and calculation logic.
To this end, we organize the relevant AUDITOR data in a structured manner and, if necessary, link it to information from other applications. Based on this, we develop a semantic model in which technical terms, relationships, and calculation logic are defined in a consistent manner.
This foundation can be used for more than just the first Power BI report. Additional analyses and queries can be added step by step without having to start from scratch for every new use case. Power BI serves as the front end, while AUDITOR remains the operational source system.
Based on the same technical foundation, Excel analyses and Copilot scenarios could also be developed in the future, in addition to Power BI reports.
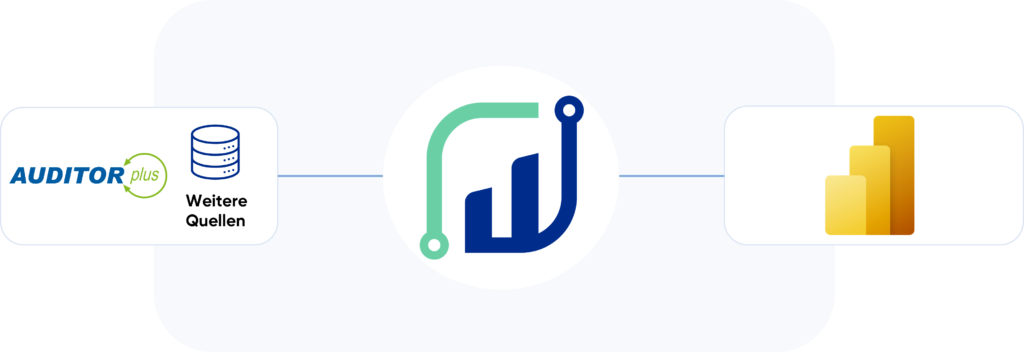
AUDITOR plus and other sources
AUDITOR data, time tracking, personnel or vacation planning, ERP systems, and other applications
Shared Database
Structured relationships and uniformly defined key performance indicators
Power BI Reports
Interactive analyses for different research questions and perspectives
A database that fits your system landscape
For further analysis, in addition to AUDITOR data, information from time tracking, HR or leave planning, measurement systems, Excel files, and other applications may also be relevant. Which sources are included depends on the specific question and the available systems.
We are aware that AUDITOR may contain particularly sensitive personal data. For this reason, both the data model and the reports can be fully operated and deployed within your local infrastructure. If you are already using cloud-based analytics platforms, hybrid or cloud-based architectures are also possible as alternatives, including those based on Microsoft Fabric.
The technical architecture of the reporting solution will also be tailored to these needs. In doing so, we will pay particular attention to requirements regarding data updates, access rights, security, and deployment.
Leverage Existing Infrastructure
Connect Additional Data Sources
Coordinate Updates and Deployment
Depending on requirements, the reporting solution can be implemented entirely on-premises, in a hybrid environment, or in the cloud. Microsoft Fabric can be used, among other things, for the automated integration, processing, and delivery of data.
If necessary, analysis results can be automatically transferred to other systems or databases, where they can be stored for permanent or appropriately structured, audit-proof documentation.
Your question as a starting point
We start by identifying the question you want to answer using your data. Together with HNC, we review your business requirements, the existing AUDITOR data, and the systems already in use.
In a joint strategy workshop, we’ll review your ideas and previous analyses and determine which additional questions need to be addressed. Based on this, we’ll develop a tailored starter package with a clearly defined initial use case.

data4success is an official partner of HNC-Datentechnik,
the manufacturer of AUDITOR plus.
Working Together to Find the Right Start
Gather questions and ideas
We take into account existing analyses, new requirements, and specific information needs.
Organizing Data and Systems
We analyze which AUDITOR data and supplementary sources are required for the selected use case.
Select a Starter Package
We define a clearly defined initial use case and the services required for it.
Experience with AUDITOR data and reporting
data4success specializes in business intelligence, data models, and cross-system reporting solutions. We focus not only on the visible reports, but also on the data structures, business context, and calculation logic that form the foundation for reliable analyses.
When working with AUDITOR data, we combine technical expertise with the specific requirements of occupational safety and health. Our team has experience with Microsoft SQL Server, Power BI, semantic models, data integration, and various deployment architectures. This enables us to present even complex data structures in a clear and understandable way while appropriately handling sensitive information.
Understanding AUDITOR Data
We analyze existing data structures and business relationships in order to systematically extract the information relevant to the specific issue at hand.
Processing Data Safely
We develop transparent data models, taking into account sensitive information, access rights, and the requirements of the existing system landscape.
Implement Reporting
We develop Power BI reports and other data solutions that answer specific business questions and are tailored to the intended users and work processes.
Frequently Asked Questions About Reporting with AUDITOR and Power BI
Here you'll find answers to frequently asked questions about analyzing AUDITOR data with Power BI and designing a suitable reporting solution.
What additional analysis capabilities does Power BI offer?
AUDITOR already provides key occupational health and safety information in a structured format. Power BI can use this data to generate customized analyses and view information from various subject areas together. If needed, data from other systems—such as time tracking or vacation planning—can also be incorporated.
This results in reports tailored to specific questions and different user groups.
What data from AUDITOR can be analyzed using Power BI?
Depending on the specific question, various types of information from AUDITOR can be included in the analysis. This includes, for example, data on individuals, organizational units and work areas, qualifications, training, hazard assessments, work materials, measures, or deadlines.
The specific information that is taken into account depends on the modules used, the content maintained, and the respective application scenario.
Can data from other systems be included?
Yes. Depending on the specific requirements, AUDITOR data can be integrated with information from other applications. This may include time-tracking data, data from HR systems for personnel and leave planning, data from ERP systems such as SAP, as well as data from measurement and sensor systems or Excel files.
Can the reporting solution be operated entirely on-premises?
Yes. If sensitive personal information is to be processed within your own infrastructure, the data model and reports can be built and deployed entirely on-premises. One possible technical foundation is Microsoft SQL Server in conjunction with Power BI Report Server.
Alternatively, hybrid or cloud-based architectures are also possible. The appropriate option depends on the existing system environment, the security requirements, and the intended user group.
How are sensitive data and access rights handled?
Access rights and role-based models are developed to align with the existing organizational structure and the specific usage scenario. Dynamic security rules—such as those based on row-level security—can ensure that users see only the information intended for their specific area of responsibility.
In doing so, we take security into account throughout the entire reporting solution, from the data sources and the data model to deployment and data updates.
What role can Microsoft Fabric play?
Microsoft Fabric can be a suitable platform when data from multiple sources needs to be automatically integrated, centrally processed, and made available for various analyses. However, Fabric is not a requirement for all AUDITOR reporting.
Whether Fabric is used, and to what extent, depends on the existing system landscape, security requirements, and the desired analyses.
Do existing reports need to be completely replaced?
No. Existing AUDITOR reports, dashboards, or Excel analyses can still be used. Together, we’ll review which analyses are already working well and where Power BI offers additional capabilities—such as connecting to additional data sources, interactive analyses, or presentations tailored to specific audiences.
How do you get started on a reporting project using AUDITOR data?
We start with the technical question that needs to be answered using the available data. In our initial discussion, we review the current situation, existing analyses, relevant data sources, and the systems in use.
Depending on the initial situation, this may be followed by a strategy workshop. Together, we’ll define a clearly delineated entry scenario and use it as the basis for developing a suitable starter package.
Can the results of the analysis be transferred back to other systems or databases?
Yes. Depending on the application scenario, analysis results can be further processed and, if necessary, automatically transferred to appropriate systems or databases. There, they can be used for downstream processes, historical analyses, or traceable documentation.
The specific implementation depends on the professional, technical, and legal requirements.
Would you like to get more out of your AUDITOR data?
If generating reports currently involves a lot of manual work, if important information from different subject areas or systems needs to be consolidated, or if additional questions arise, it’s worth taking a closer look at your reporting structure.
We'd be happy to discuss with you what data you already have and how we can use it to create a suitable Power BI solution.