
Conciseness in communication: the CONDENSE principle of IBCS
Welcome back to our series on the International Business Communication Standards (IBCS). In today's article, we focus on the CONDENSE principle, the fourth element of the SUCCESS formula. CONDENSE calls for information to be condensed concisely in order to ensure efficient and effective communication. What does CONDENSE mean? CONDENSE, or "condensing" in German, places the emphasis [...]
Clear paths through the data jungle: the SIMPLIFY principle from IBCS
Welcome back to our series on the International Business Communication Standards (IBCS). In today's post, we face a key challenge in business communication: how can we simplify complex information without losing meaning? This is where the SIMPLIFY principle, the first element of the SUCCESS formula, comes into play. What does SIMPLIFY mean? SIMPLIFY, which means "simplify", is more [...]
Learn something new every day: our 2024 Christmas party with a difference!

In our job as consultants for business intelligence and AI, one thing is clear: we always have to be open to new things. Learning is part of our everyday life - be it Power BI today, Microsoft Fabric tomorrow or the latest Copilot the day after tomorrow. Our success depends on how quickly we can adapt to new technologies. This constant [...]
Expressiveness in business communication: The EXPRESS principle of IBCS
Welcome to another insightful article in our series on the International Business Communication Standards (IBCS). Today we focus on the EXPRESS principle, the fifth element of the SUCCESS formula. EXPRESS calls for a clear and meaningful presentation of information in order to achieve maximum impact in business communication. What does EXPRESS mean? EXPRESS, in the sense of "expressing", [...]
Why looking at the previous year is no longer enough: an appeal for data-driven decisions
There is a fundamental problem in the German economy: controllers and sales staff often only compare their data with the previous year. This method may have worked in stable times, but in today's dynamic business world it often leads to wrong decisions. The problem with year-on-year comparisons Between 2010 and 2019, it was best practice to compare business figures with [...]
Structure creates clarity: the STRUCTURE principle of IBCS
Welcome back to our continuing series on the International Business Communication Standards (IBCS). In this article, we will take a closer look at the fourth principle of the SUCCESS formula: STRUCTURE. This principle emphasizes the importance of a clear and logical structure in reports and presentations. What does STRUCTURE mean? STRUCTURE stands for "structuring". In business communication, [...]
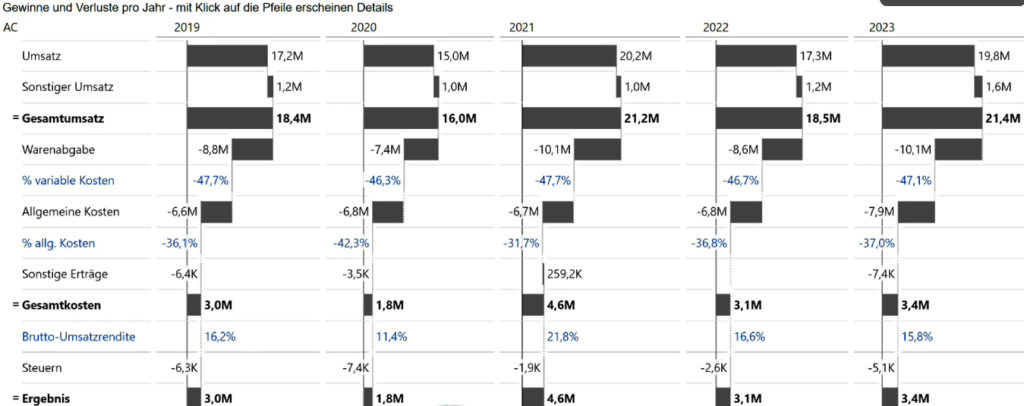
Analysis of margins and prices for articles and customer groups

Do you know the margins of your articles? Many companies know which customer generates which turnover or which articles are the most successful. But what about the margins? These are crucial, as they depend directly on purchase prices and sales prices. And only if you know these can you manage your prices optimally. In this blog article, we would like to [...]
Clear messages, strong impact: the SAY principle of IBCS
Welcome back to our series on the International Business Communication Standards (IBCS). Today we dive deeper into the SAY principle of the SUCCESS formula. SAY, the third element of this formula, plays a key role in how clear and meaningful messages can be conveyed in reports and presentations. What does SAY mean? SAY stands for "express". In the [...]
Magic Excel files - Automated data updating for greater efficiency

Who isn't familiar with monthly reporting, budget monitoring and sales reports? For many of us, this usually means logging into an ERP system such as Microsoft Dynamics once a month, downloading the required data and copying it into Excel or PowerPoint. This manual process is not only time-consuming, but also carries the risk of errors and outdated data. [...]
How companies can leverage hidden profit potential through targeted margin analysis

In the business world, everything revolves around the margin, not just turnover. Because while turnover describes the size of a company, the margin shows how profitable it actually is. The margin tells you how much profit a company makes from its revenue after costs have been deducted. A detailed margin analysis - especially [...]