

SAP provides valuable insights into a wide range of business processes. With Power BI, you can establish a common foundation for metrics, analyses, and decisions, and gain clarity on how things are connected, rather than looking at isolated individual reports.
Different definitions make it difficult to arrive at a common classification.
Revenue, margin, and discounts are often calculated or interpreted differently in various reports. Instead of having a common data source, this leads to discussions about which figure is correct.
Rising revenue is only part of the story. The impact on margins, costs, products, or customer relationships can often only be understood through extensive analysis.
Budget figures, forecasts, and operational SAP data are often analyzed separately. As a result, variances are identified late, and the causes are difficult to trace.
Data is exported, formatted in Excel, and regularly recombined. Valuable time is spent creating reports rather than analyzing and evaluating trends.
Sales, Controlling, Purchasing, and Management often look at different slices of the same data. There is no shared view of the relationships and implications.
The challenge rarely lies in creating additional reports. What matters most is a shared database with clearly defined metrics and transparent relationships.
SAP contains valuable information on revenue, orders, inventory, costs, and many other business processes. However, simply providing this data is not enough to make well-informed decisions. What is crucial are consistent definitions, clear relationships, and a common data foundation for all stakeholders.
Data from sales, purchasing, production, warehousing, finance, and other SAP areas form the foundation.
Key metrics are clearly defined. Calculation rules, filter logic, and business relationships are defined centrally.
Individual transactions are used to create a consistent information base with standardized metrics and dimensions.
Key metrics and relationships are made transparently available through interactive analyses, reports, and dashboards.
Management, controlling, and functional departments all have access to the same information and make decisions based on shared facts.
The added value does not come from additional reports, but from a shared understanding of the underlying metrics.
Only on this common foundation can business questions be answered reliably. From sales trends to margin analyses to inventory and forecast evaluations, all analyses draw on the same metrics and definitions.
Consistently defined key performance indicators provide the foundation for a wide variety of analyses. From sales trends and margin analyses to inventory and forecast evaluations, all analyses draw on the same database.
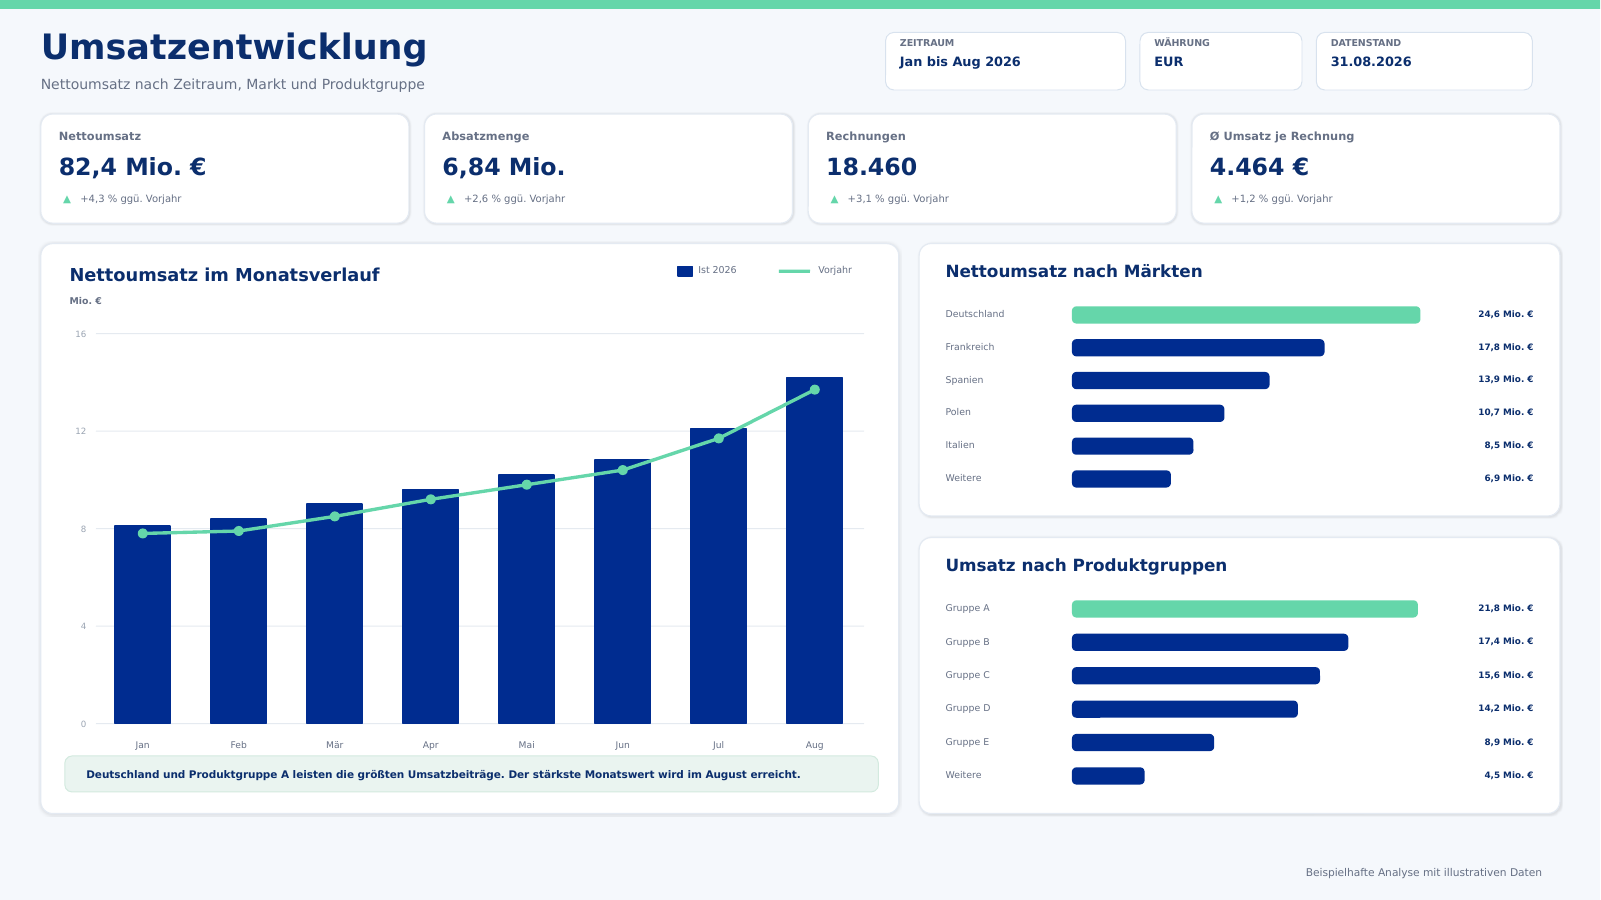
Keep track of sales trends across products, customers, regions, and time periods, and identify changes early on.
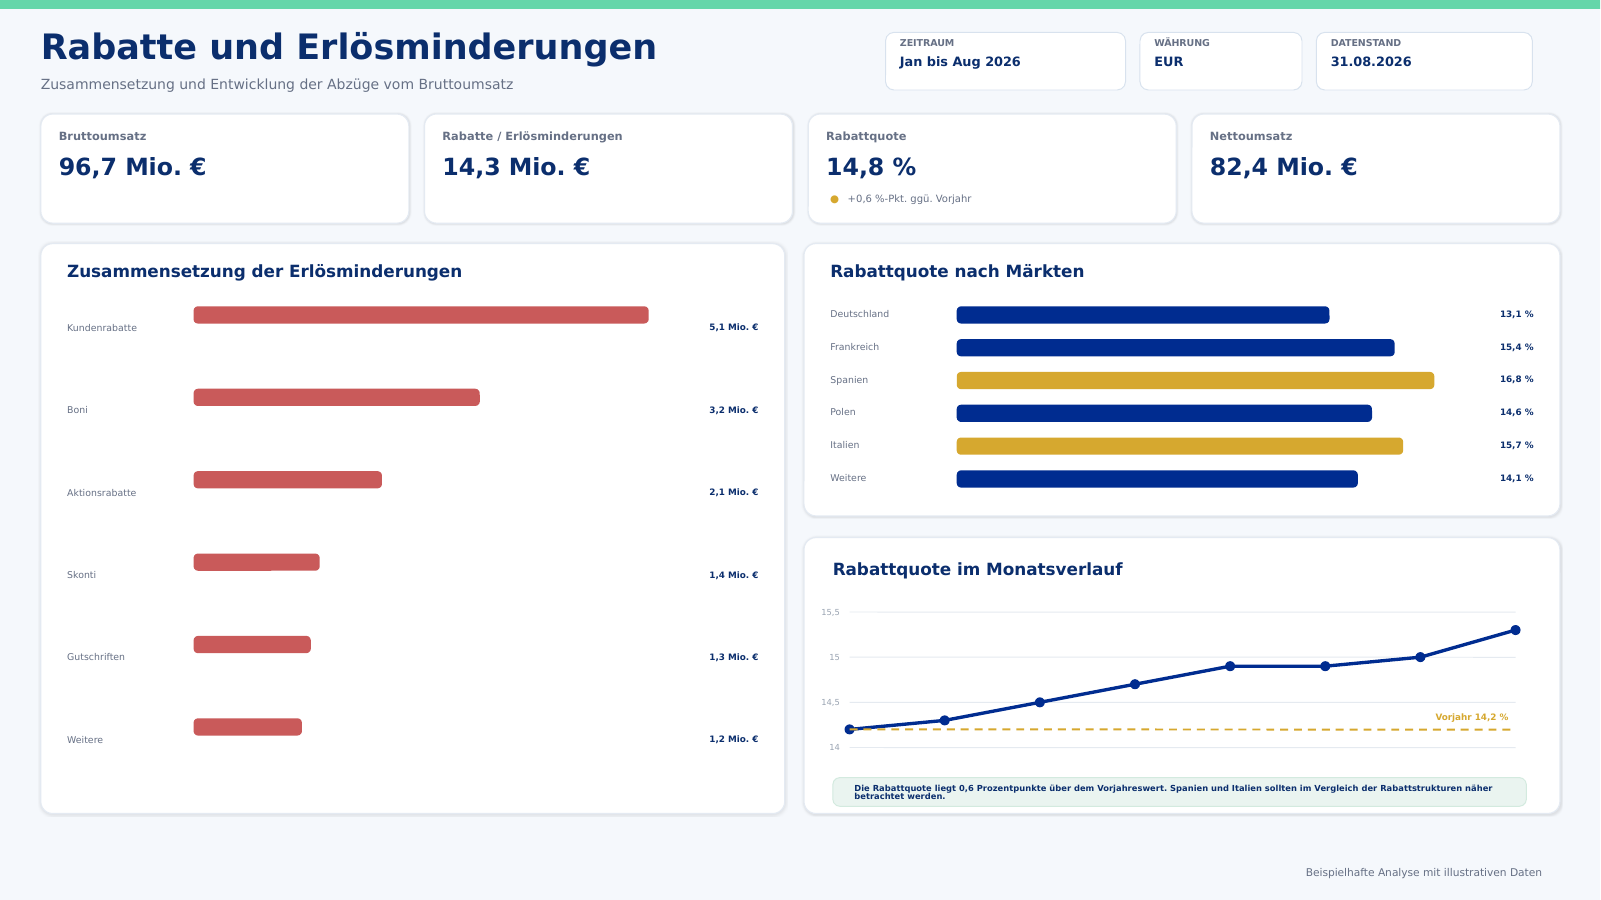
Show which discounts, price reductions, and revenue reductions affect the bottom line and how these trends are changing.
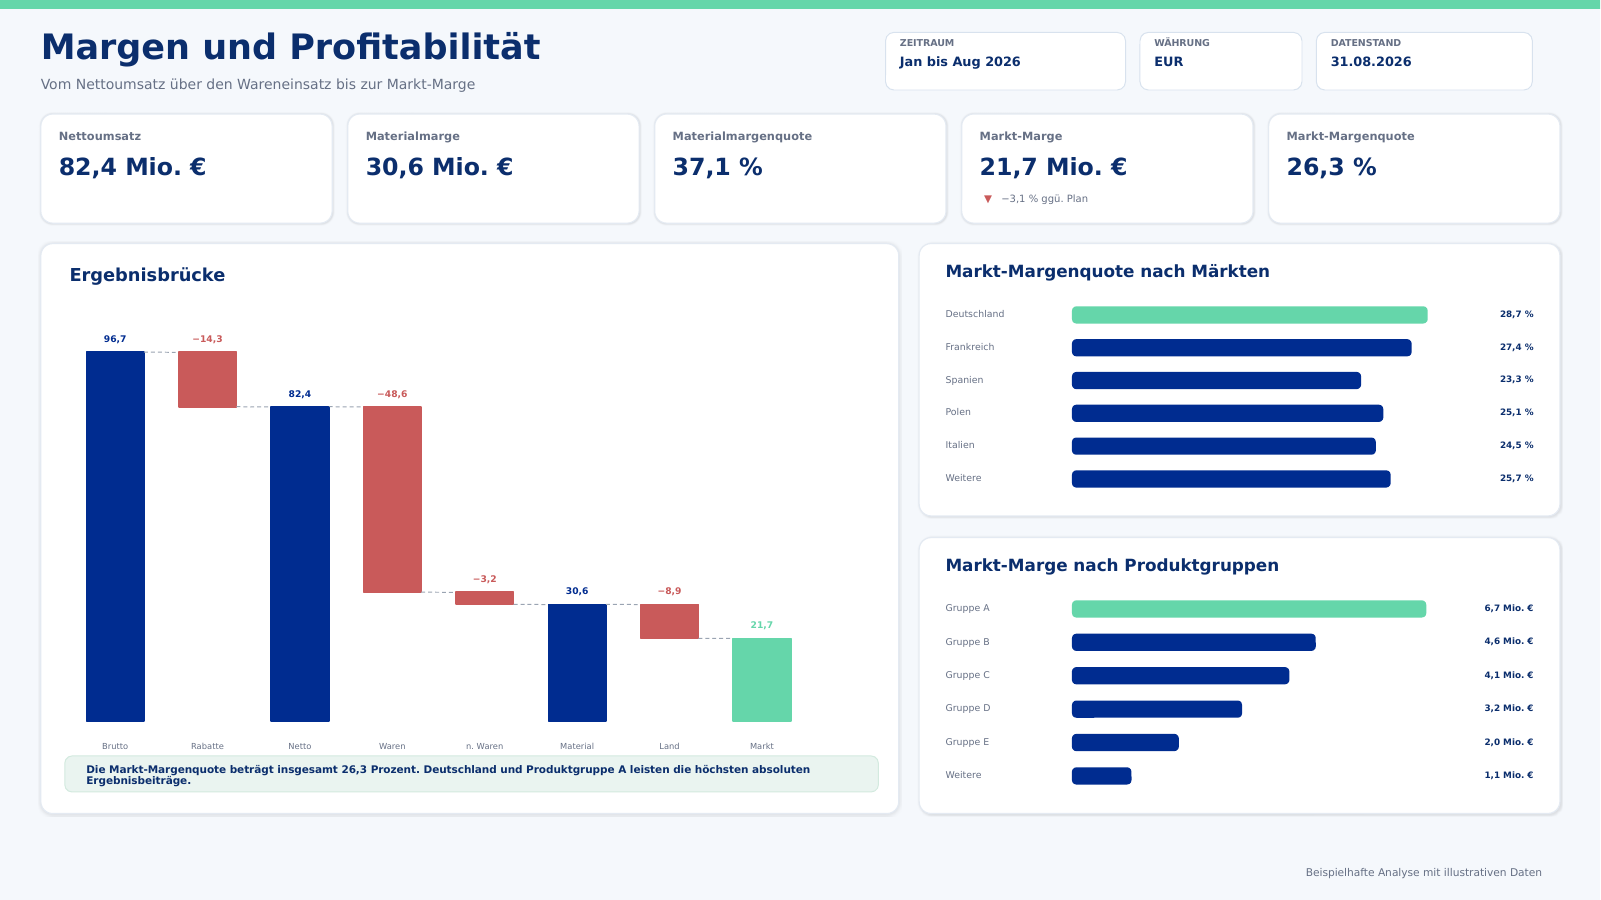
Analyze profitability from various perspectives and identify the key factors that influence your bottom line.
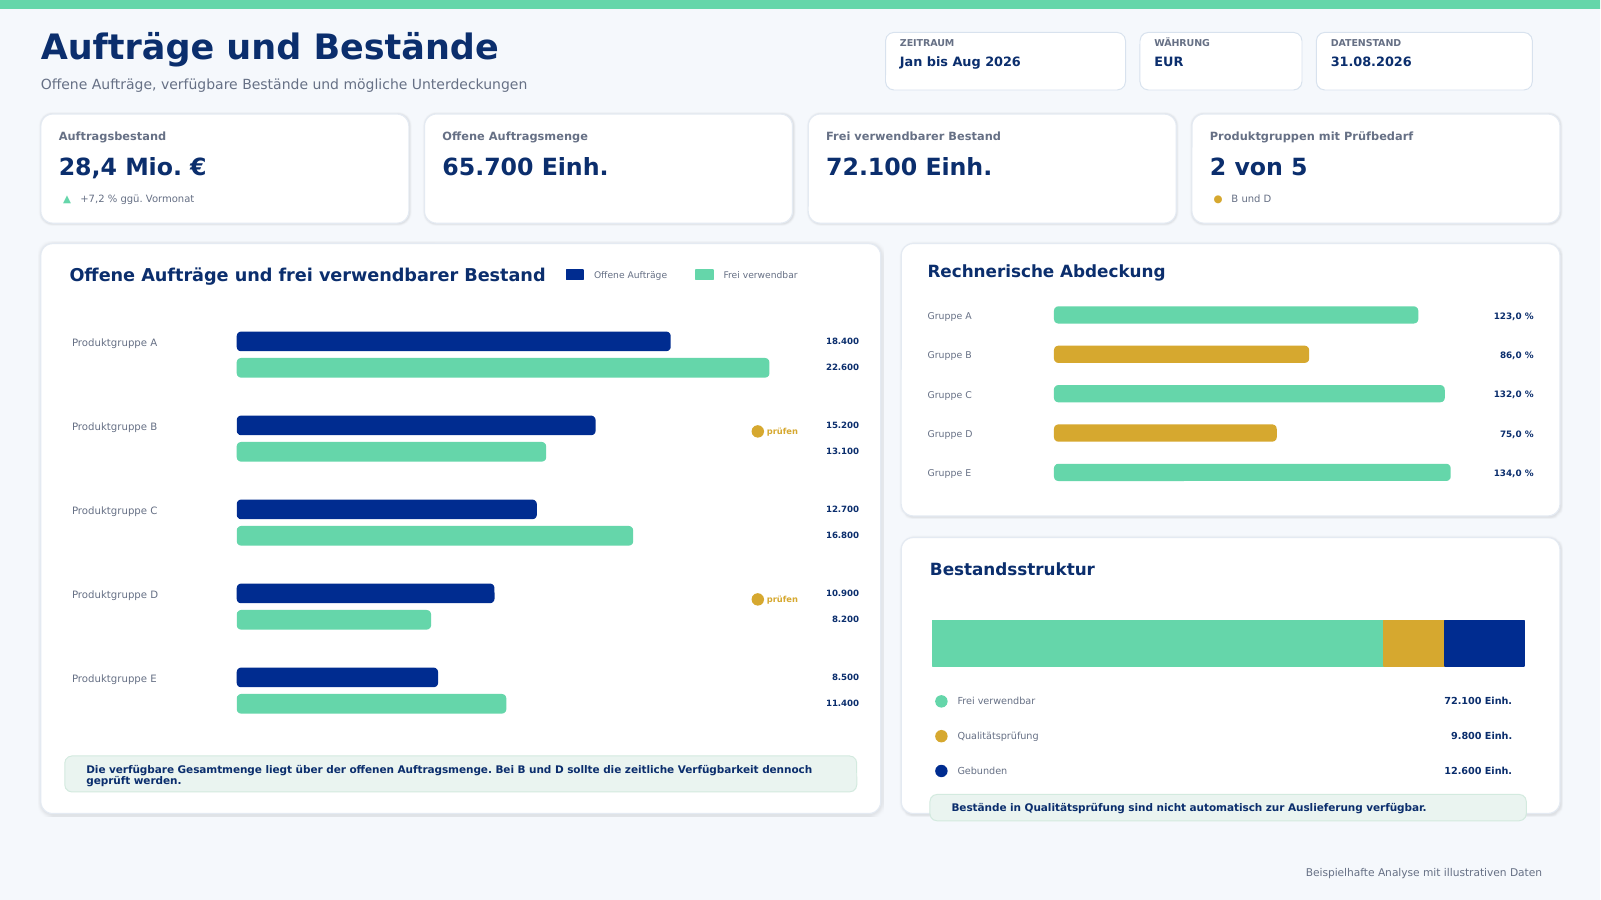
Combine order and inventory information to identify availability issues, bottlenecks, and trends early on.
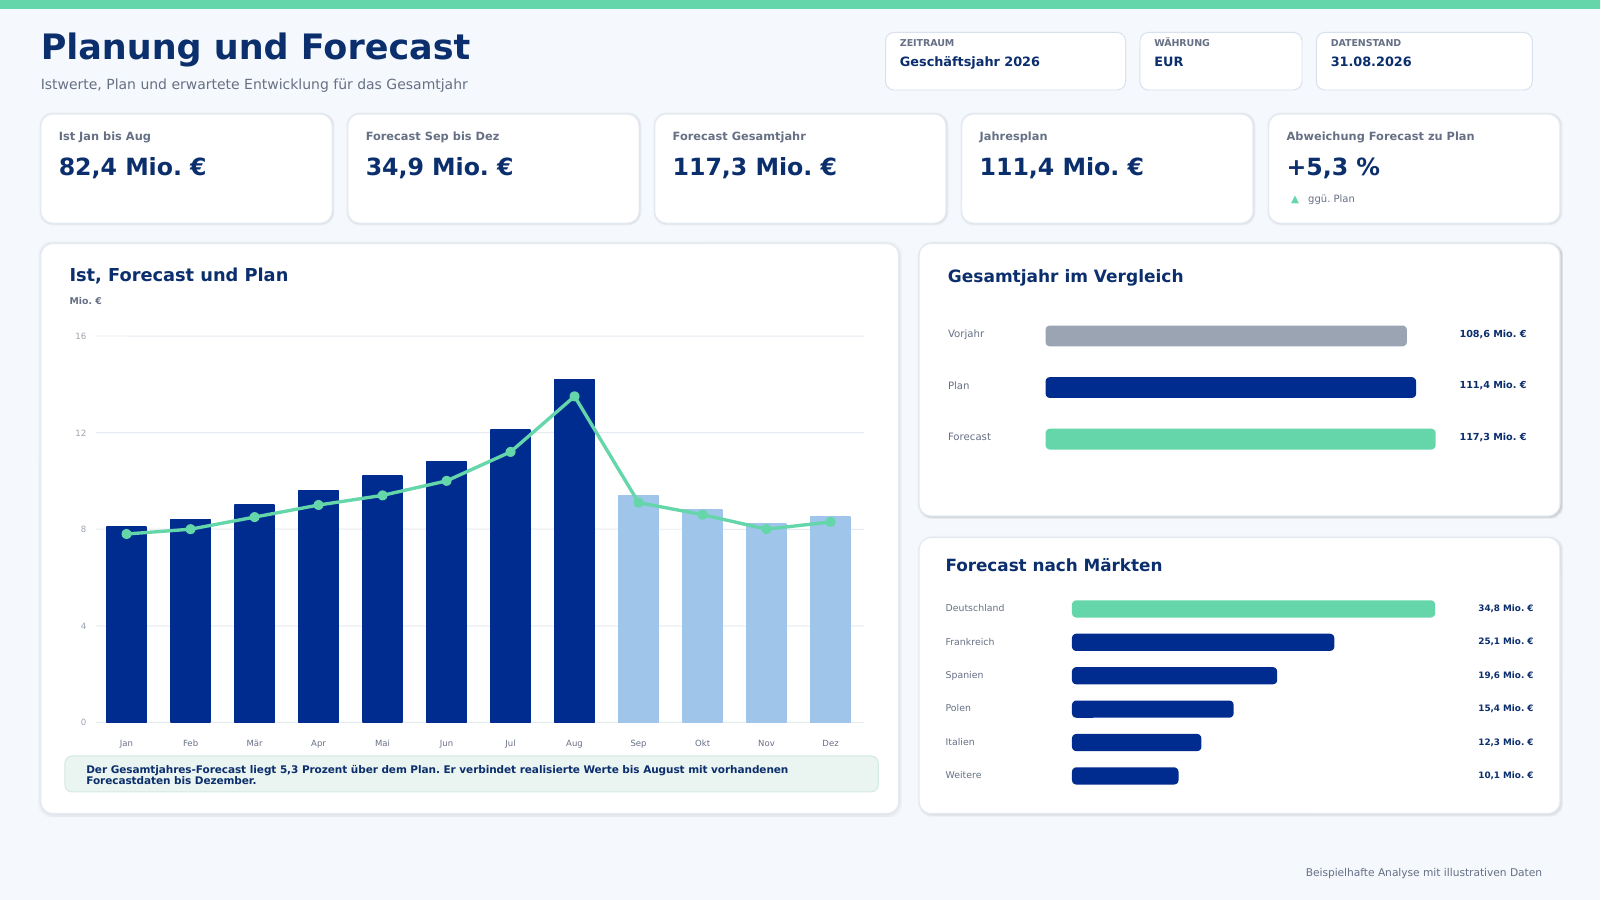
Compare planned figures, forecasts, and actual data on a common basis and gain transparency into variances and trends.
All analyses draw on the same database and the same key metrics. This results in clear, traceable connections rather than isolated individual reports.
The true strength of a shared metrics model becomes apparent when correlations become visible. Instead of looking at individual values in isolation, trends can be analyzed from various perspectives.
Individual key figures provide important insights. However, they only become truly meaningful when viewed in the context of additional information. This makes it possible to identify causes, track trends, and make informed decisions.
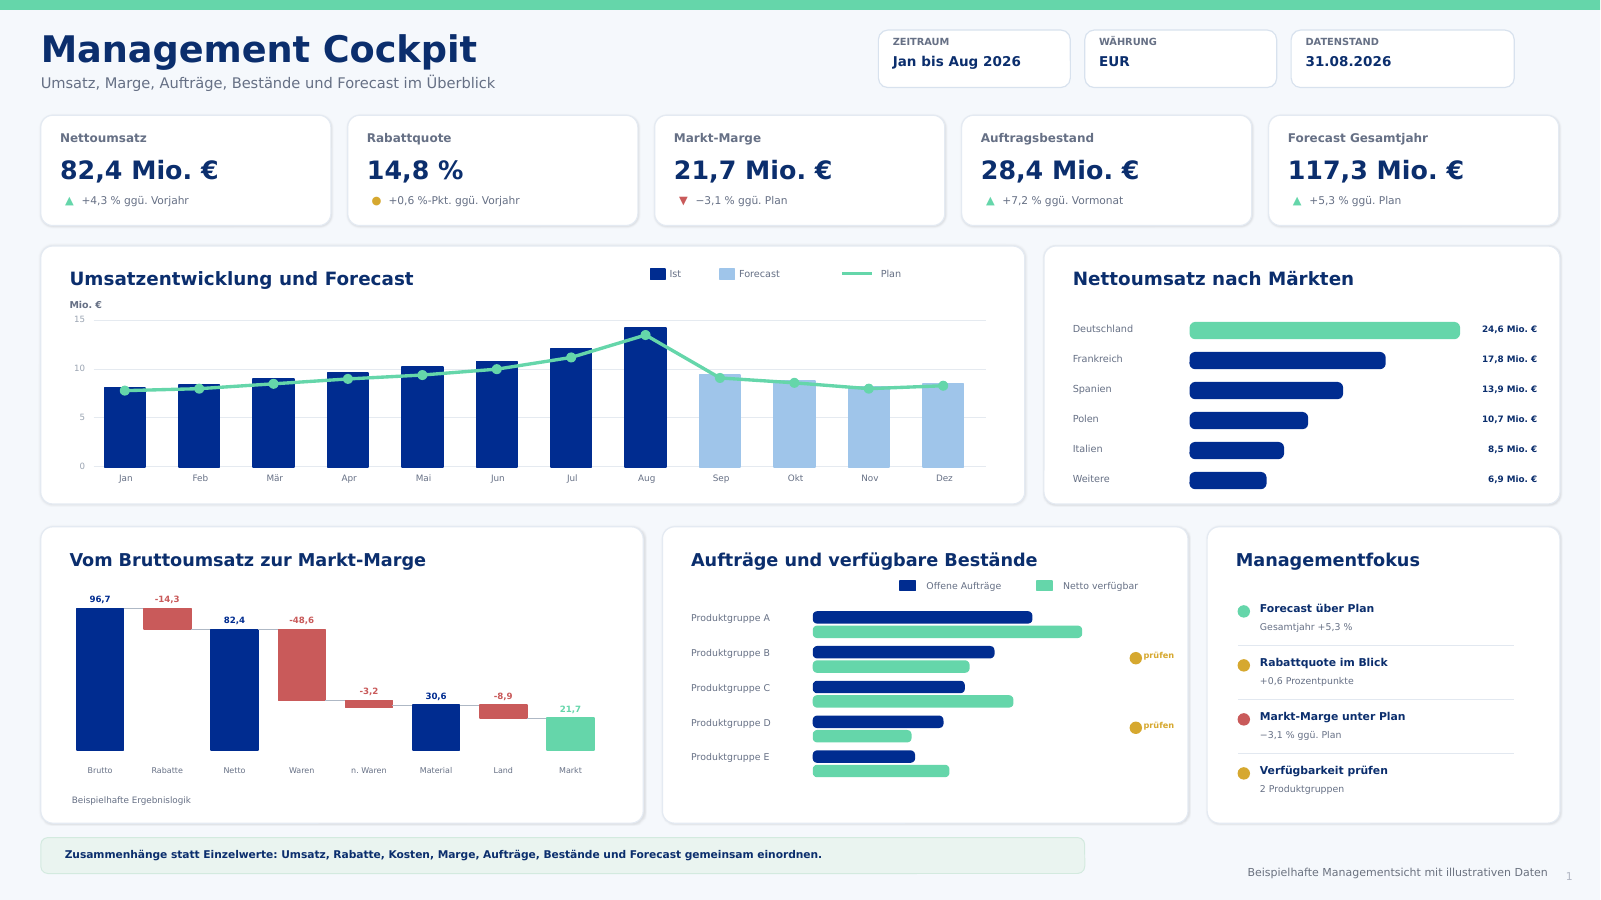
Rising sales initially appear to be a positive sign. Only when viewed in conjunction with discounts, costs, and margins does it become clear how much this trend actually contributes to the company's success.
Deviations aren't just visible. They can be traced back to specific products, customers, regions, or time periods and explained in a clear and understandable way.
The combination of operational metrics, inventory data, and forecasts helps identify changes before they begin to affect earnings.
Management, controlling, and functional departments all access the same data source. As a result, decisions are based on shared definitions and transparent relationships.
The greatest value is not derived from individual metrics, but from understanding how they are interconnected.
To ensure that key metrics, analyses, and decisions are consistently based on a uniform foundation, they require a common data source and clearly defined structures.
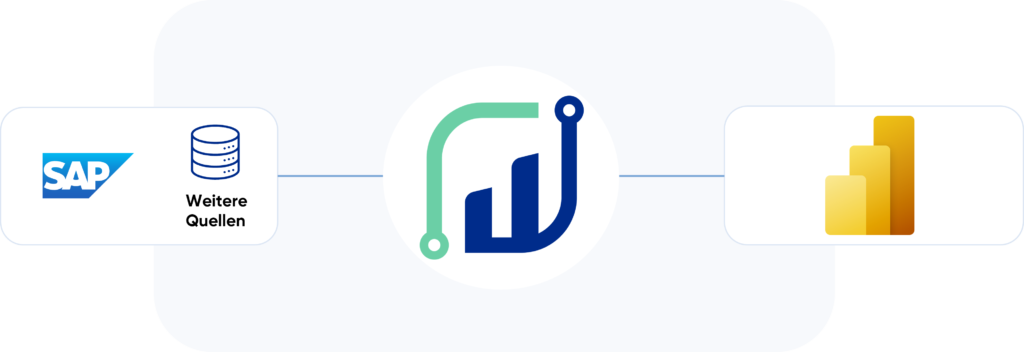
Reliable analyses start with a structured data foundation. To this end, SAP data is prepared according to business requirements, equipped with clear calculation rules, and made available in a shared model for Power BI. If necessary, additional relevant data sources can be incorporated.
SAP · Planning Data · Excel Files · Other Business Systems
Data preparation · business structures · defined metrics · shared dimensions
Management Reports · Industry Analyses · Interactive Detailed Analyses
SAP data is consolidated from the relevant business processes and structured so that it can be used for cross-functional analyses.
Calculation rules for revenue, discounts, margins, inventory, or other key metrics are defined centrally. As a result, different reports use the same definitions.
Planned figures, forecasts, Excel files, or information from other applications can supplement the SAP data and open up additional perspectives for analysis and management.
New questions, metrics, and analyses can be added to the existing database without having to build a completely new foundation for each report.
Depending on the existing system architecture, the database can be implemented and expanded using existing technologies or modern platform services such as Microsoft Fabric.
Consistent analyses result when data, business rules, and key performance indicators are integrated on a common foundation.
The following example illustrates how such a combination of SAP data, business metrics, and Power BI analyses might look in practice.

Our collaboration with Denk Pharma demonstrates how SAP data, business metrics, and Power BI analyses come together in a unified reporting environment.
data4success has built an SAP-based reporting environment for Denk Pharma, complete with a data warehouse and a centralized Power BI semantic model. It links analyses of sales, margins, costs, orders, and inventory with supplementary planning data from SAP Integrated Business Planning. The collaboration also includes the further development of the database, access control issues, and knowledge transfer.
Every SAP environment, every key metric, and every business question comes with its own set of requirements. That’s why we work with you to develop the reporting framework—from clarifying business questions to implementing and refining the solution.
Together, we'll determine which decisions need support, which analyses are already available, and where additional transparency is needed.
We review the relevant SAP data, customer-specific characteristics, and supplementary sources. Together, we agree on definitions, signs, time periods, and calculation rules.
The required data is collected, processed, and linked through common dimensions. This results in a consistent model for key performance indicators and analyses.
The required Power BI reports are generated based on the shared model. Key metrics and visualizations are reviewed with the relevant departments using specific comparison scenarios.
Even after the initial implementation, we continue to support updates, access, and further development. Knowledge transfer helps users apply the new reporting framework confidently and independently.
The appropriate SAP reporting framework is built on specific business questions, agreed-upon key performance indicators, and a database developed in stages.
The specific implementation depends on your SAP landscape, the available data, and the desired analyses. Answers to frequently asked questions about data provision, architecture, and usage can be found in the following section.
From data provision to the authorization model, the right solution depends on your SAP landscape and the analyses you want to perform. Here, we answer some frequently asked questions.
Our implementation to date includes, among other things, sales and earnings data, actual and planned financial figures, sales orders, shipments, material and batch information, and inventory levels. In addition, key metrics from SAP Integrated Business Planning have been integrated. We will assess which data can be used in your environment based on your system landscape and your business requirements.
Yes. Existing SAP reports do not necessarily need to be replaced. To start, we’ll work together to identify which reports already exist, what requirements they cover, and where additional business context or analytical perspectives are needed. Power BI can specifically complement the existing reporting landscape and create new opportunities where data, key metrics, or planning information need to be viewed holistically.
Yes. Key performance indicators can be defined according to business requirements and made available in the shared model. For example, in the existing reference implementation, individual calculations were implemented for net sales, material and market margins, country and head office costs, as well as various availability metrics. Customer-specific allocations and market-related discounts were also taken into account.
Yes. In the current implementation, SAP actual values are linked to data from SAP Integrated Business Planning. This includes an annual overview that combines realized values through the previous month with the expected demand for the remainder of the year. Which planning and forecast data are included in a new project depends on the available sources and the desired analyses.
The reference described on this page uses an upstream SQL-based data warehouse. Power BI imports business-ready data from it. The appropriate method of data provision for a new project should be determined based on the specific SAP and system environment.
No. The appropriate architecture depends on the existing system landscape, the data sources, and the business requirements. Microsoft Fabric can be considered as a modern platform component for deploying and further developing a database, but it is not a general prerequisite for SAP reporting with Power BI.
Yes. A common reporting framework does not mean that all users must see the same information. In the current implementation, regional filters and object-specific restrictions for different user groups have been defined in the semantic model. An authorization scheme can thus take into account functional responsibilities and varying security requirements.
Whether it's revenue trends, margins, inventory availability, or comparing actual figures with forecasts: Together, we'll review your existing data and analyses to determine which reporting framework best suits your business needs and your SAP landscape.