
Semantic Model Concentration: A Simple KPI for Power BI Governance
Many companies make extensive use of Power BI. Over time, this often results in a large number of reports, semantic models, specialized analyses, and ad hoc solutions that have evolved over time.
The big question is:
To what extent does our own reporting landscape actually focus on centralized, reusable semantic models?
Cover in well-constructed environments 1-2 Data Models whole 80% from the reports.
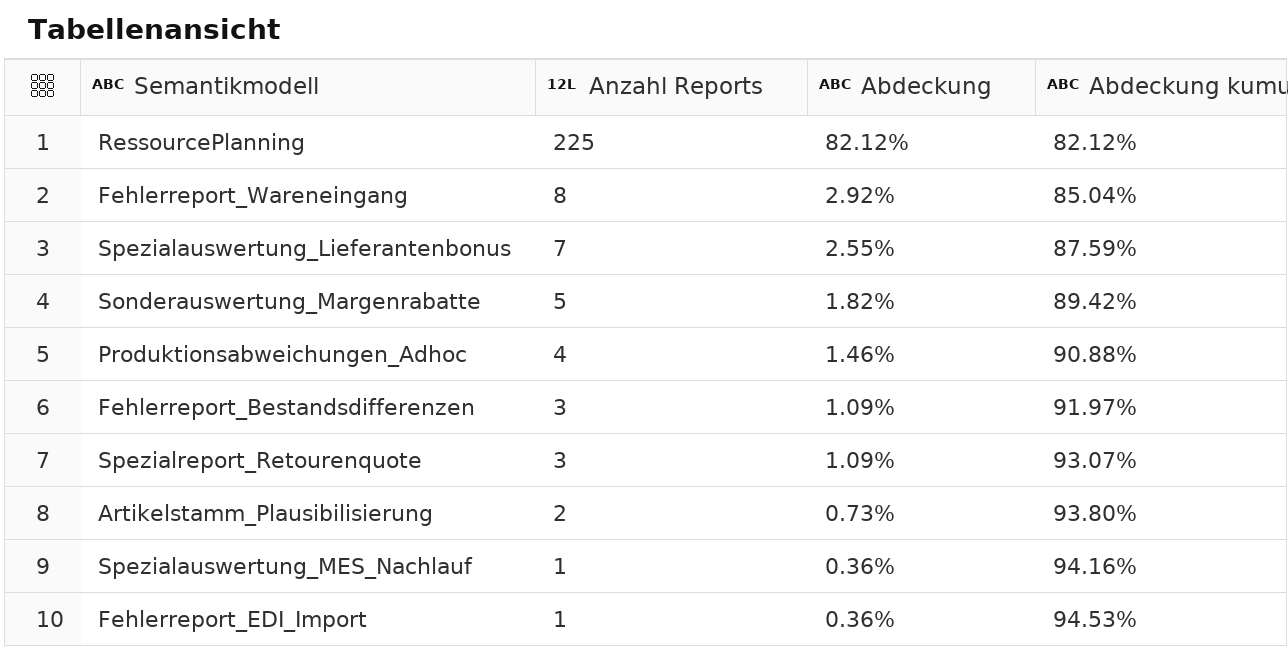
Is this the case for you, too? With this free Fabric notebook, you can see in just 5 minutes how your teams have been working in Power BI. It analyzes, within the permission context of the user running it, which Power BI reports access which semantic models.
The result is a compact table containing:
- Semantic Model
- Number of Reports
- Cover
- Cumulative coverage
This makes it easy to see whether the BI architecture is based on reusable data models or whether many small, isolated solutions have accumulated over time.
This notebook serves as a practical starting point for discussions about Power BI governance, data quality, and Microsoft Fabric.
It does not contain any macros or executable files.
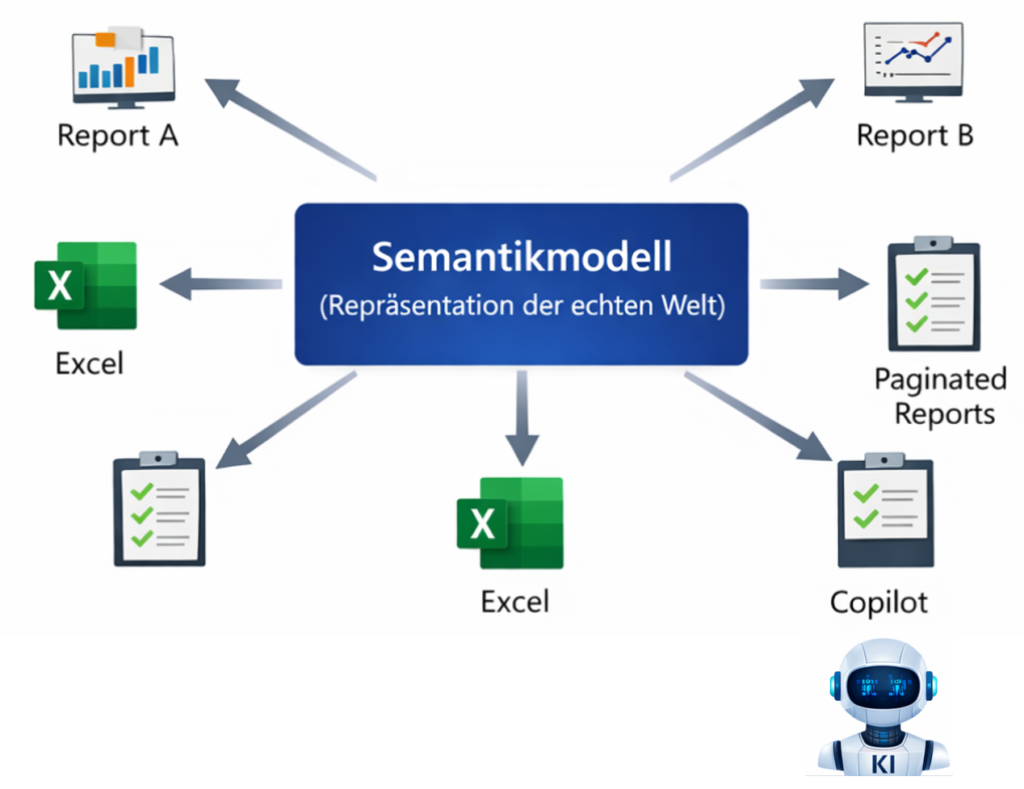
Because your entire company can be managed based on a semantic model. When Excel files, reports, PDF reports, and AI agents all draw on the same semantic model, consistency is ensured across all decisions.
If you have any questions about how to use or interpret the information, please feel free to schedule a free appointment via Teams.
If you currently only have Power BI but don't yet have Fabric, you can license it company-wide starting at approximately 170 EUR/month. You can find instructions on exactly how to set it up in this video (or you can ask us in person).