Power BI: How to display a web page dynamically within Power BI using HTML5 Visual?

Power BI offers numerous options for visualizing and analyzing data. But did you know that you can also dynamically display a web page within Power BI? Using the HTML5 visual and an iFrame, you can seamlessly integrate external web pages into your report and link them to your data. In this blog post we will show [...]
Power BI: Display measures in rows

Power BI is a powerful business intelligence tool that allows you to connect, transform and visualize data from various sources. One of the most common visualizations in Power BI is the matrix, which provides a tabular representation of data with rows, columns and values. When you use Measures in a matrix, they [...]
Welcome aboard!

We are proud to welcome our new employee Ms. Thu Trang Tran! With her years of experience in #BusinessIntelligence projects and her passion for #dataanalytics, she will add significant value to our customers. #PowerBI and #SQL programming are part of her portfolio as well as #Tableau and SAP Analytics Cloud. Welcome on board!
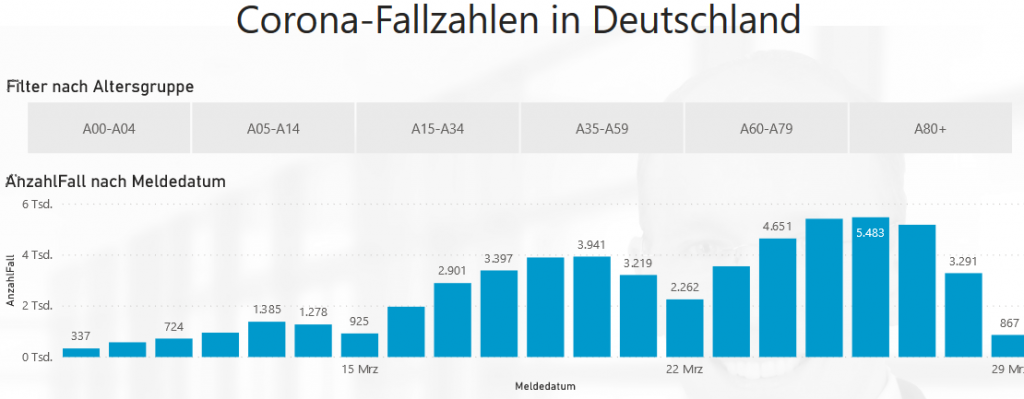
Evaluate Corona infections in PowerBI

Here is an example of how the current Corona figures can be evaluated in Power BI. The numbers update daily based on the data published on corona.rki.de. The evaluation has 4 different pages at different aggregation levels. By clicking on the bars, you can filter everything else on each page. The corresponding PowerBI file can be [...]
Difficulties of the companies with VerpackG reports

According to my observation, the companies currently have the following difficulties with the reporting of packaging data according to the new packaging law: The packaging materials and their weights per article are often not recorded at all. In most cases, every retailer / producer has his software in which all his article data is recorded. This software (individual developments or standard software) is mostly not yet [...]
Excel Calculator for PackagingG

On the page https://data4success.de/rechner-verpackungsgesetz you will now find an Excel calculator with which online stores, producers and retailers can calculate simple reports to the Central Packaging Register Office themselves. Have fun with it!
Microsoft Dynamics NAV module for PackagingG?

All users of the ERP system Microsoft Dynamics NAV who are affected by the Packaging Act (formerly Packaging Ordinance VerpackV) in Germany are now wondering how they can make the declarations to the central office in the first place. Often, packaging materials are not even recorded in the ERP system in the first place, and the logic around declarations of exemption from liability by creditors and debtors is not recorded either. [...]
What data on sales and products must a company record for the Packaging Act?

In order to be able to make the reports to the central office (verpackungsregister.org) correctly, companies must have a variety of data as a basis for calculation, which may not yet exist. Roughly, you need to know: What is the packaging of a product I sell? How many products of what size have I put on the market in Germany? [...]
Power BI with Navision: Which customers buy which items?

A really simple example of how to use Microsoft Dynamics NAV together with Power BI. Business Intelligence in a very simple way. What does it show? It shows which are the best customers, as the size in the ring chart corresponds to the accounts receivable turnover. In addition, it shows which items bring in the most revenue. These are shown in the bar chart [...]
Let there be light!

Let there be light! More transparency for producers using Microsoft Dynamics! Do you produce your own goods, or sell them to customers? Then you have a lot of complex processes from purchasing, production, warehouse, logistics, sales reporting, all mapped in NAV. Our job is to make this treasure trove of data transparent to your departments in such a way that your departments [...]
