
When you log in to your bank, you have probably already seen the progress of your account balance as a graph. Now imagine having a similar interactive display that shows you how the value of your stock items is developing. This is exactly what is possible with modern analysis tools in Microsoft Dynamics NAV (Navision) and Dynamics 365 Business Central and brings great benefits for your company.
Stock as a "heartbeat"
Every stock movement, whether incoming or outgoing goods, is stored in your ERP system such as Dynamics NAV or Business Central. Their monetary valuations are also recorded there, which in turn flow directly into your G/L accounts and represent the fixed assets in your balance sheet. If you look at these movements graphically over a period of time, a typical "heartbeat" emerges - the warehouse fills up, empties, fills up again and so on.
From the overview to the detail
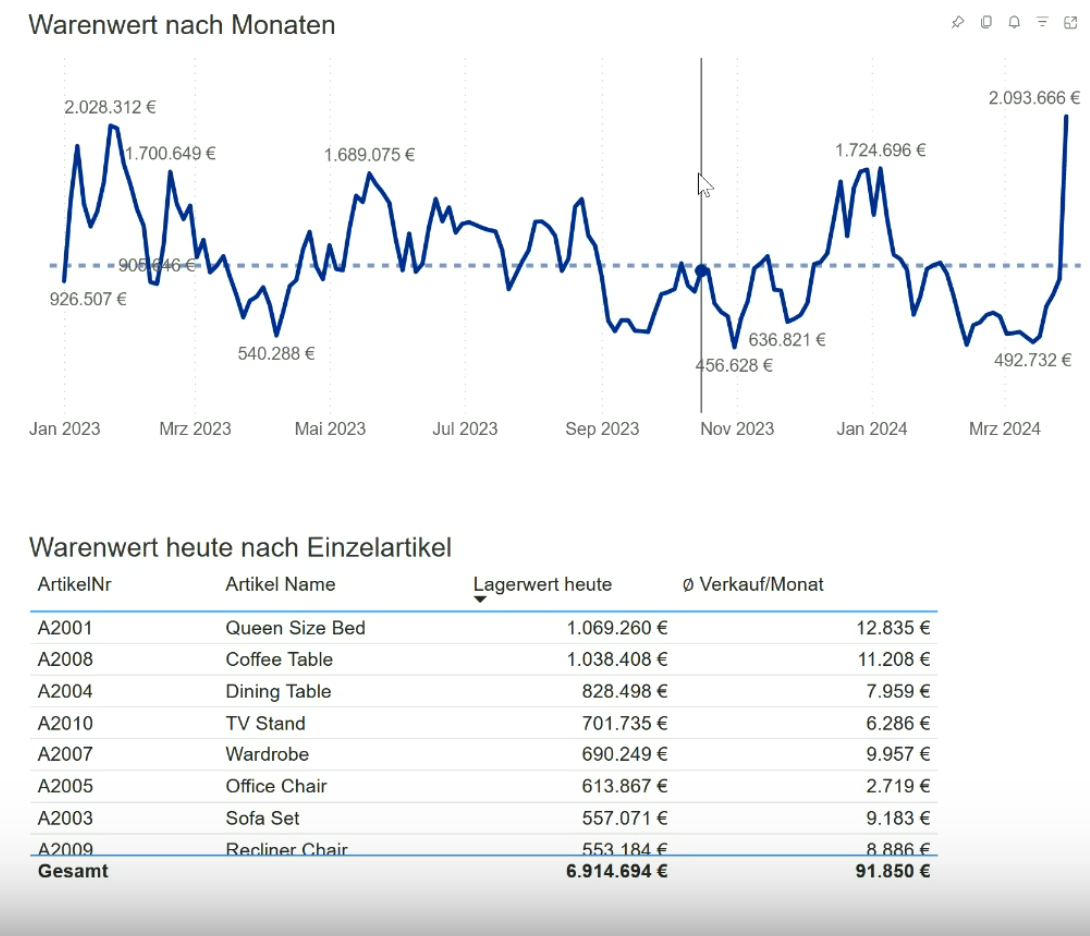
Imagine you could see this "heartbeat" graphically for each individual item. Let's take a coffee table as an example: at the beginning, you might have goods worth 1.6 million euros in stock. Then you sell for 600,000 euros, reorder and sell again. This process repeats itself cyclically and creates a clear, interpretable curve. The same principle can be applied to all your items, whether dining table, TV stand or office chair - each item has its own characteristic stock curve.
Analyses for better business
The special thing is that most ERP systems such as Navision and Business Central only show you the current stock value without making its development graphically comprehensible. However, a graphical analysis allows you to react to trends and optimize your purchasing. You can recognize when you need to reorder in order to always be able to deliver and avoid tying up unnecessary capital in the warehouse.
Effective control of your stock levels
In addition, you can analyze not only at the level of individual items, but also at the level of product categories. If you are particularly interested in the development of your bedroom furniture, for example, you can see at a glance which items in this category have the highest value of goods and where there is potential for optimization.
The system also takes into account the range of the items: You know exactly how long your current stock will last and can plan precisely when you need to reorder. This allows you to recognize the critical time for replenishment at an early stage and effectively avoid supply bottlenecks.
The graphical representation of stock movements in Dynamics NAV, Navision or Business Central gives you important insights that help you to make your warehousing more efficient and cost-saving. Use the "heartbeat" of your stock levels to improve your liquidity and manage strategically.
Do you have any questions or would you like to find out more about our methods? Get in touch with us - We show you how you can use your data for sustainable success.